How to find z score in R-Easy Calculation-Quick Guide
z score how to find?, z-score provides how many standard deviations away a value is from the mean.
We can use the following formula for z-score calculation.
z-score = (x-μ)/σ
x is a raw score to be standardized;
μ is the mean of the population;
σ is the standard deviation of the population.
In this article, we are describing z score calculation in different cases.
Linear optimization using R » Optimal Solution »
Example 1:- Single Vector
data <- c(8, 7, 7, 10, 13, 14, 15, 16, 18)
z score how to find?
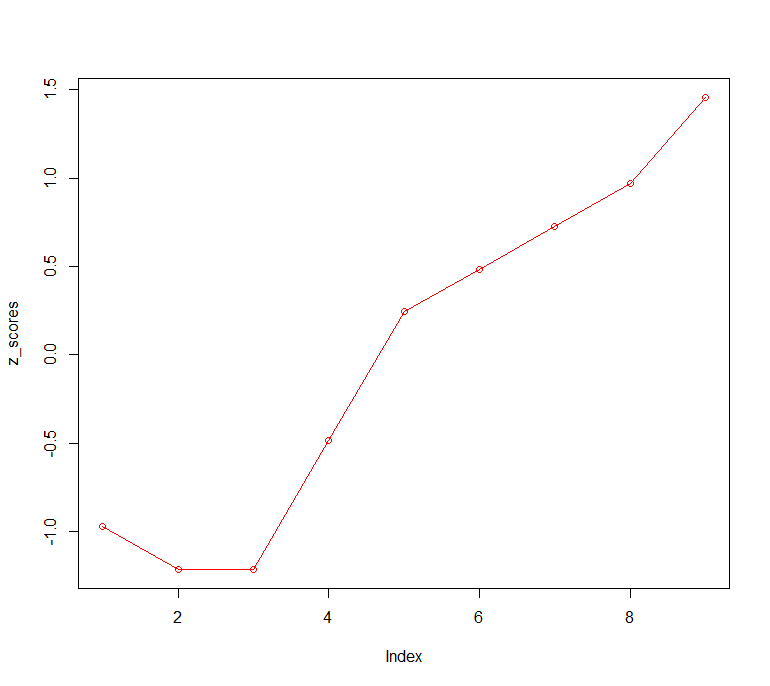
z_scores <- (data-mean(data))/sd(data)
z_scores
-0.9701425 -1.2126781 -1.2126781 -0.4850713  0.2425356  0.4850713  0.7276069  0.9701425  1.4552138
Inference
The first raw data value of “8” is 0.9701425 standard deviations below the mean.
The first raw data value of “7” is -1.2126781 standard deviations below the mean.
The ninth raw data value of “18” is 0.2425356 standard deviations above the mean.
Market Basket Analysis in R » What Goes With What »
Plot
plot(z_scores, type="o", col="red")
Cluster Analysis in R » Unsupervised Approach »
Example 2:- Single Column in a DataFrame
data<- data.frame(A = c(2, 5, 6, 7, 9, 13),
                 B = c(24, 20, 13, 15, 19, 20),
                 C = c(15, 5, 7, 18, 14, 10))
z_scores <- (data$B-mean(data$B))/sd(data$B)
z_scores
1.3970014 0.3810004 -1.3970014 -0.8890009 0.1270001 0.3810004
Inference
The first raw data value of “24” is 1.3970014 standard deviations above the mean.
The first raw data value of “20” is 0.3810004 standard deviations above the mean.
And so on
How to run R code in PyCharm? » R & PyCharm »
Example 3: Every Column in a DataFrame
We can make use of sapply function here,
sapply(data, function(data) (data-mean(data))/sd(data))
        A          B          C
[1,] -1.3363062  1.3970014  0.6986042
[2,] -0.5345225  0.3810004 -1.2974078
[3,] -0.2672612 -1.3970014 -0.8982054
[4,]  0.0000000 -0.8890009  1.2974078
[5,]  0.5345225  0.1270001  0.4990030
[6,]  1.6035675  0.3810004 -0.2994018
Inference
The first value of “2” in the first column is 1.3363062 standard deviations below the mean value of its column.
The first value of “5” in the first column is 5345225 standard deviations below the mean value of its column.
Proportion test in R. How to do?, Conditions, Types of tests and inference
Application
One of the common examples is a student’s class marks for an exam that appears to be normal and it has a mean of 50. Now we want to know one of the best students who scored a 75 is among the top 10% of the scorers.
z score test statistic makes this calculation fairly easy.
Z= (value – mean)/ (Standard Deviation)
Using a z table, you can get the corresponding p-value test statistic for this z score, it indicates whether a score of 75 is in the top 10% of the class or not.
In general, the z score tells you how far a value is from the average of the data in terms of standard deviations.
Intraclass Correlation Coefficient in R-Quick Guide »
Subscribe to the Newsletter and COMMENT below!
[newsletter_form type=”minimal”]