ggpairs in R- A Brief Introduction to ggpairs
In this article, we are going to compare pairs and ggpairs functions in R.
1. pairs() in R
pairs() function mainly used to plot a scatter diagram corresponding to each data frame.
Syntax: pairs(data)
This will return with Color, Labels, Panels, and by Group in-pairs plot.
We will make use of mtcars package here.
Let’s store some variable into data.
Naive Bayes Classification in R » Prediction Model »
data<-dplyr::select(mtcars,mpg,disp,hp)
pairs(data)

The diagonal boxes are column variables and the remaining combination of variables scatter plots.
How to clean the datasets in R? » janitor Data Cleansing »
You can modify the color, Shape of Points, Labels & Title
pairs(data,
      col = "blue",
      pch = 8,
      abels = c("var1", "var2", "var3"),
      main = "Piar Plot in R")
You can learn more about pch here. You can directly call from mtcars data set also.
Normality Test in R » How to Perform » Easy Steps »
pairs(~ mpg + disp + hp+wt, data = mtcars)

2. ggpairs in R
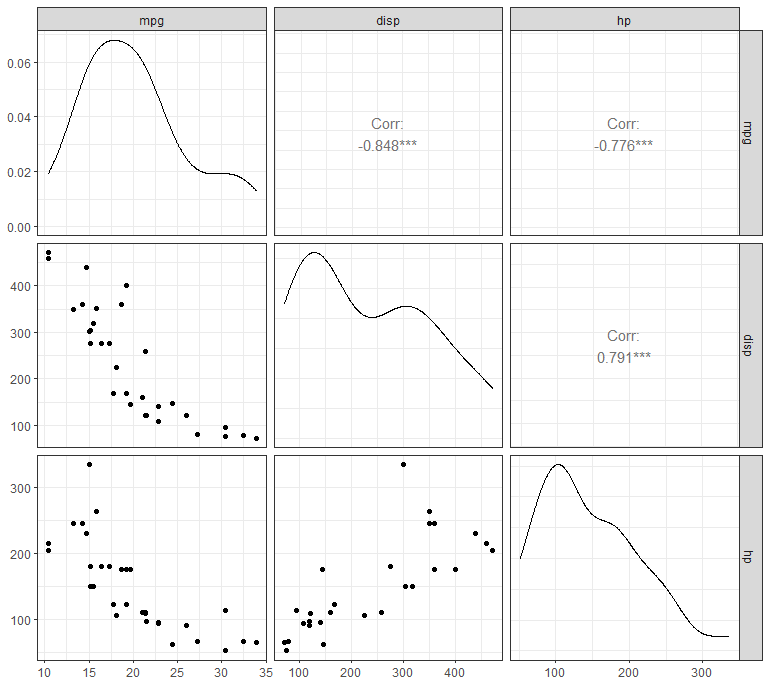
The ggpairs() function from the GGally package allows us to build a great scatterplot matrix. Scatterplots of each pair visualized in left side of the plot and Pearson correlation value and significance displayed on the right side.
If you are not installed the ggplot2 and GGally, Let’s install it.
install.packages("ggplot2")
install.packages("GGally")
library("ggplot2")
library("GGally")
ggpairs(data)+theme_bw()
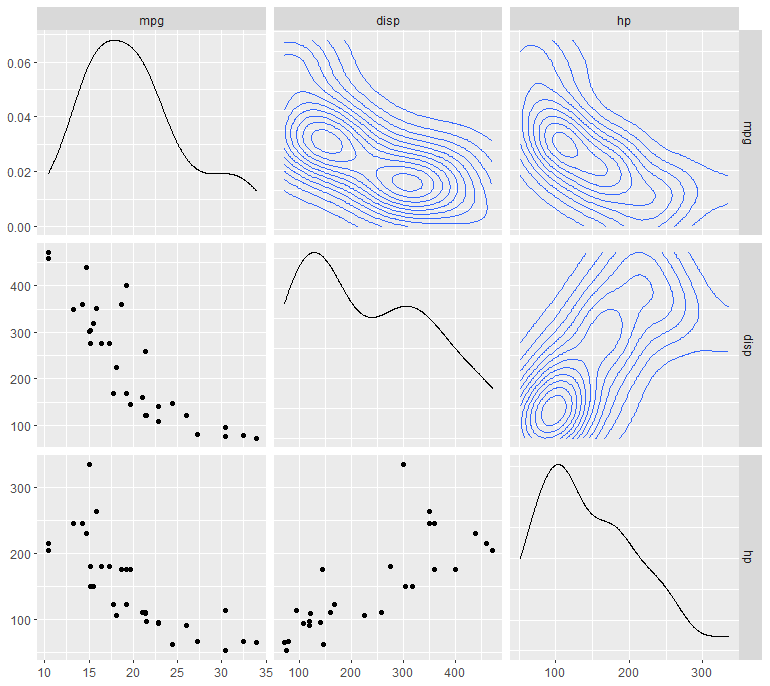
You can visualize differently also,,
ggpairs(data,
upper = list(continuous = "density", combo = "box_no_facet"),
lower = list(continuous = "points", combo = "dot_no_facet"))
Let’s make use of some other dataset for better visulization.
data(tips, package = "reshape")
ggpairs(
tips[, c(1, 3, 4, 2)],
upper = list(continuous = "density", combo = "box_no_facet"),
lower = list(continuous = "points", combo = "dot_no_facet"))

data(flea)
ggpairs(flea, columns = 2:4, ggplot2::aes(colour=species))

Conclusion
ggpairs plot provides the useful information and handy to use.
Kruskal Wallis test in R-One-way ANOVA Alternative »
Subscribe to the Newsletter and COMMENT below!
[newsletter_form type=”minimal”]