Normality Test in R
Normality Test in R:-In statistics methods is classified into two like Parametric methods and Nonparametric methods.
The majority of the test like correlation, regression, t-test, and analysis of variance (ANOVA) assume some certain characteristics about the data. They require the data to follow a normal distribution.
The test data follow normal distribution then parametric tests are appropriate because their validity depends on the distribution of the data.
Before doing a parametric test need to check basic assumptions, If any of the assumptions do not hold true nonparametric methods come to the rescue.
Shapiro-Wilk’s method is extensively advocated for normality check and it gives higher power than K-S. It is primarily based totally on the correlation between the information and the corresponding regular scores.
Load Data
library(MASS)
head(ships)
type year period service incidents
1    A   60     60     127         0
2    A   60     75      63         0
3    A   65     60    1095         3
4    A   65     75    1095         4
5    A   70     60    1512         6
6    A   70     75    3353        18
data<-droplevels(subset(ships,ships$year=="60"))
Subset data based on year to check data is normally distributed or not.
Normality Test in R
Before doing the Shapiro-Wilk test, check the graphical representation of the data.
First need to understand that, normality test is sensitive to sample size. Majority of cases small samples pass normality tests. Therefore, it’s important to combine visual inspection and significance tests in order to make the right decision.
Based on the central limit theorem, the sampling distribution tends to be normal if the sample is large (n > 30). However need to verify the same statistically,
The following cases you can try for normality checking,
- Visual Identification
- Shapiro Wilks Test
- Skewness & Kurtosis
Visual Identification
library(ggpubr)
ggqqplot(data$service)
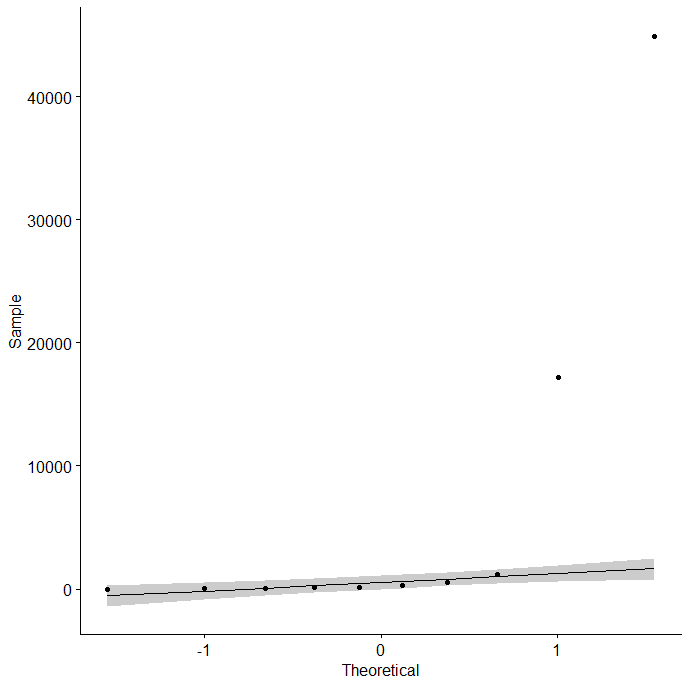
It is clearly some of the outliers affected the distribution.
Basis plot information normality assumption failed and nonparametric methods are more appropriate.
library(car)
qqPlot(data$service)
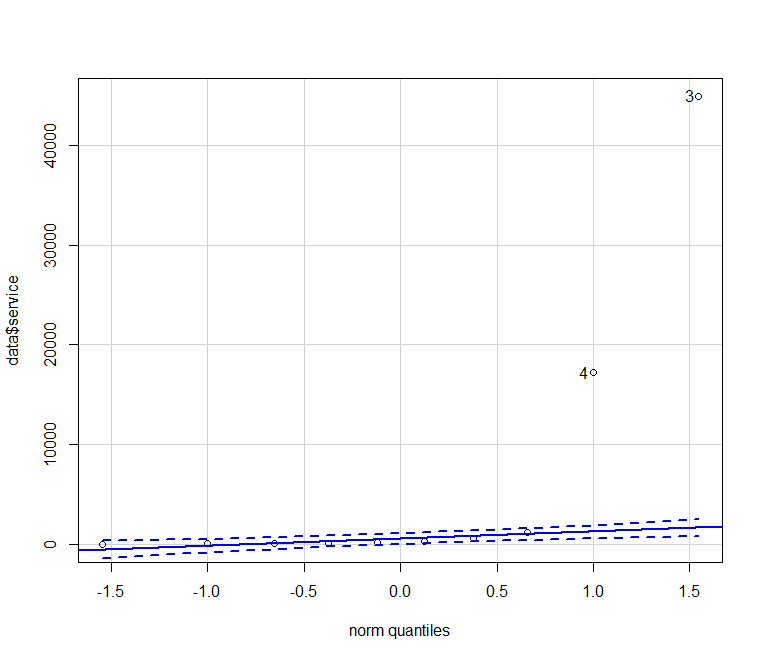
In other cases remove the outlier and test again.
library(DescTools)
Kurt(data$service)
1.974241
Kurtosis value is far away from 3, indicate non-normality.

shapiro.test(data$service)
Shapiro-Wilk normality test in R
data:  data$service
W = 0.52927, p-value =8.03e-06
Conclusion
From the output, the p-value < 0.05 implying that the distribution of the information is drastically special from the regular distribution. In different words, we will not count on normality.