R Plot pch Symbols: Different point shapes in R
R plot pch symbols, In this tutorial we are going to describe different pch values in R. The plotting argument used to specify point shapes is pch.
Let’s install the ggpubr package from cran, and then plot different shapes in R.
#install.packages("ggpubr")
ggpubr::show_point_shapes()
R Plot pch Symbols
The 25 different points symbols are commonly used in R for making beautiful graphs.
tidyverse in r – Complete Tutorial » Unknown Techniques »
- pch = 0,square
- pch = 1,circle
- pch = 2,triangle point up
- pch = 3,plus
- pch = 4,cross
- pch = 5,diamond
- pch = 6,triangle point down
- pch = 7,square cross
- pch = 8,star
- pch = 9,diamond plus
- pch = 10,circle plus
- pch = 11,triangles up and down
- pch = 12,square plus
- pch = 13,circle cross
- pch = 14,square and triangle down
- pch = 15, filled square
- pch = 16, filled circle
- pch = 17, filled triangle point-up
- pch = 18, filled diamond
- pch = 19, solid circle
- pch = 20,bullet (smaller circle)
- pch = 21, filled circle blue
- pch = 22, filled square blue
- pch = 23, filled diamond blue
- pch = 24, filled triangle point-up blue
- pch = 25, filled triangle point down blue
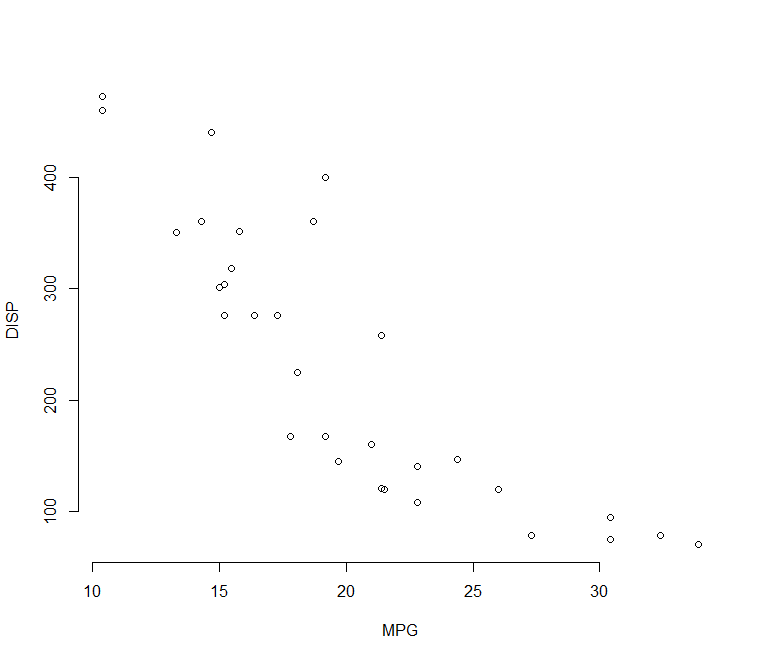
Let create a default plot pch = 1 (empty circle)
Deep Neural Network in R » Keras & Tensor Flow
plot(x = mtcars$mpg, y = mtcars$disp, frame = FALSE,
     xlab = "MPG", ylab = "DISP")
As mentioned above, we can change different pch values.
Principal component analysis (PCA) in R »
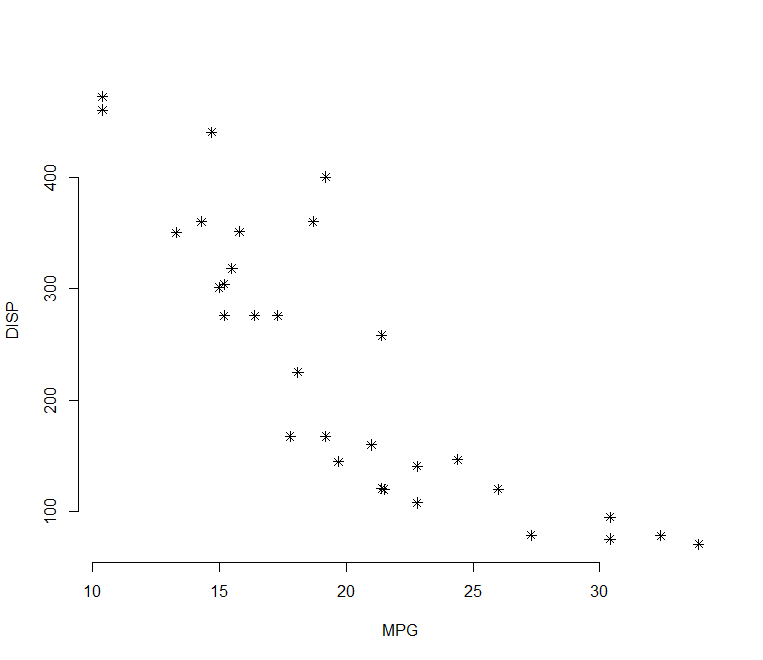
Change plot symbol to pch = 8 (star)
plot(x = mtcars$mpg, y = mtcars$disp, frame = FALSE,
     xlab = "MPG", ylab = "DISP",
     pch = 8)
If you want to change the color and the size of points, use the following arguments
- col: For example, col = “red” or col = “#FF0000”.
- cex: the size of point symbols. Numeric values, 1=default, 1.5 is 50% larger, 0.5 is 50% smaller, etc.
For making attractive plots you can make use of bg and lwd arguments also.
- bg: plot background color
- lwd: ine width relative to the default (default=1). 2 is twice as wide
If you want to know more about lwd check it here
Line types in R: Ultimate Guide For R Baseplot and ggplot »
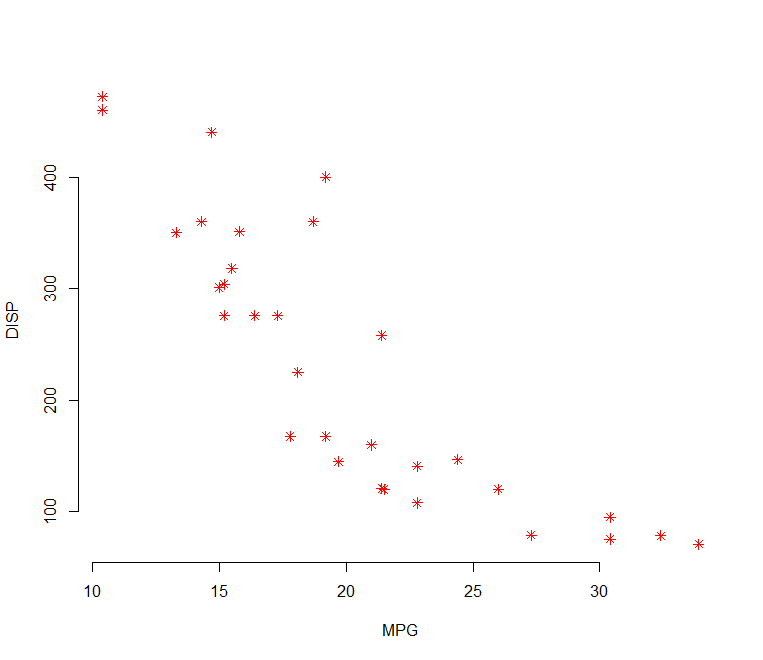
Change color and background
plot(x = mtcars$mpg, y = mtcars$disp, frame = FALSE,
     xlab = "MPG", ylab = "DISP",
     pch = 8, col =  "#FF0000")
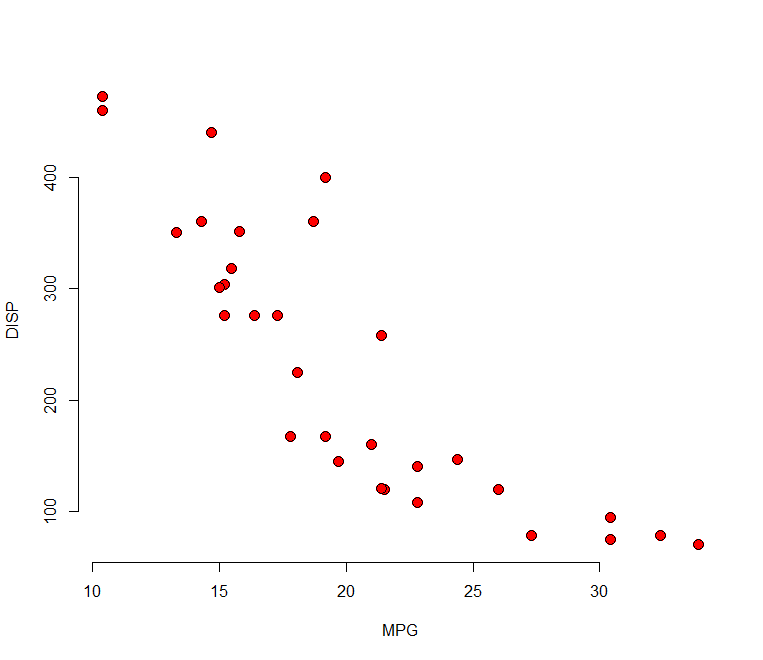
Use pch = 21 and change border line width (lwd), and background color (bg)
plot(x = mtcars$mpg, y = mtcars$disp, frame = FALSE,
     xlab = "MPG", ylab = "DISP",
     pch = 21, bg = "red", col = "black",
     lwd = 0.9, cex = 1.5)
QQ-plots in R: Quantile-Quantile Plots-Quick Start Guide »
Enjoyed this article? Don’t forget to show your love, Please Subscribe the Newsletter and COMMENT below!