3D Plot in R Programming-Quick Guide
3D Plot in R, one of the quickest ways to create a 3D plot is to use the persp() function.
3D plot the data points on three axes to highlight the link between three factors.
Let’s see the syntax.
persp(x, y, z)
Approach 1: Basic 3D Plot in R
Let’s create a basic 3D plot,
#define x and y
x <- -20:20
y <- -20:20
we create a z value based on the function of x and y
QQ-plots in R: Quantile-Quantile Plots-Quick Start Guide »
z_val <- function(x, y) { sqrt(x ^ 2 + y ^ 2)}#create z-values
z<-outer(x, y, z_val)
#create a 3D plot
persp(x, y, z)

Approach 2: Customisation
Let’s change the axis labels, title, color, and shade of the plot
aggregate Function in R- A powerful tool for data frames »
#create a 3D plot
persp(x, y, z, xlab='X Variable', ylab='Y Variable', zlab='Z Variable',
main='3D Plot', col=”orange”, shade=.4)

Approach 3: Rotate the 3D Plot
Sometimes need to rotate the 3D plot to make it better understanding, then make use of the theta and phi arguments:
Compare data frames in R-Quick Guide »
#create a 3D plot
persp(x, y, z, xlab='X Variable', ylab='Y Variable', zlab='Z Variable',
main='3D Plot', col='red', shade=.4, theta = 30, phi = 15)

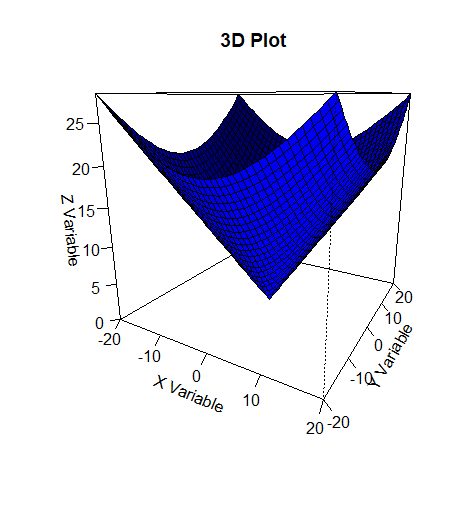
Approach 4: Add Tick Marks to the 3D Plot
The following code shows how to use the tick type argument to add tick marks with labels to each axis:
How to find z score in R-Easy Calculation-Quick Guide »
#create a 3D plot
persp(x, y, z, xlab='X Variable', ylab='Y Variable', zlab='Z Variable',
main='3D Plot', col='blue', shade=.4, theta = 30, phi = 15, ticktype='detailed')

How to Calculate Phi Coefficient in R » Association »


