Exploratory Data Analysis (EDA)
Exploratory Data Analysis is one of the critical processes of performing initial investigations on data analysis.
Basic idea is to discover the patterns, anomalies, test hypotheses, and check the assumptions with the help of summary statistics and graphical representations.
The main idea about exploratory data analysis are
- maximize insight into a data set;
- uncover underlying structure;
- extract important variables;
- detect outliers and anomalies;
- test underlying assumptions;
- develop parsimonious models;
- determine optimal factor settings.
Exploratory Data Analysis
library(tidyverse)
library(DataExplorer)
The dataset we are using for exploratory data analysis is from gss_cat.
gss_cat
The datasets contains 21,483 observations and 9 variables.
# A tibble: 21,483 x 9
    year marital      age race  rincome
   <int> <fct>      <int> <fct> <fct>
 1  2000 Never mar~    26 White $8000 to~
 2  2000 Divorced      48 White $8000 to~
 3  2000 Widowed       67 White Not appl~
 4  2000 Never mar~    39 White Not appl~
 5  2000 Divorced      25 White Not appl~
 6  2000 Married       25 White $20000 -~
 7  2000 Never mar~    36 White $25000 o~
 8  2000 Divorced      44 White $7000 to~
 9  2000 Married       44 White $25000 o~
10  2000 Married       47 White $25000 o~
Dataset Overview
gss_cat %>% glimpse()
Above function will provide basic idea about variables in the datasets.
Rows: 21,483
Columns: 9
$ year    <int> 2000, 2000, 2000, 2000,~
$ marital <fct> Never married, Divorced~
$ age     <int> 26, 48, 67, 39, 25, 25,~
$ race    <fct> White, White, White, Wh~
$ rincome <fct> $8000 to 9999, $8000 to~
$ partyid <fct> "Ind,near rep", "Not st~
$ relig   <fct> Protestant, Protestant,~
$ denom   <fct> "Southern baptist", "Ba~
$ tvhours <int> 12, NA, 2, 4, 1, NA, 3,~
Introduce
gss_cat %>% introduce()
Let’s introduce the data set based on introduce function.
rows columns discrete_columns continuous_columns all_missing_columns total_missing_values complete_rows total_observations memory_usage
  <int>   <int>            <int>              <int>               <int>                <int>         <int>              <int>        <dbl>
1 21483       9                6                  3                   0                10222         11299             193347       784776
Now you can see the dataset contains 21483 observations with 9 variables all other kind of information’s.
Visualization
Most EDA techniques are graphical in nature with a few quantitative techniques. Here we are going to explain different kind of visualization techniques to identify the pattern and relationships.
gss_cat %>% plot_intro()
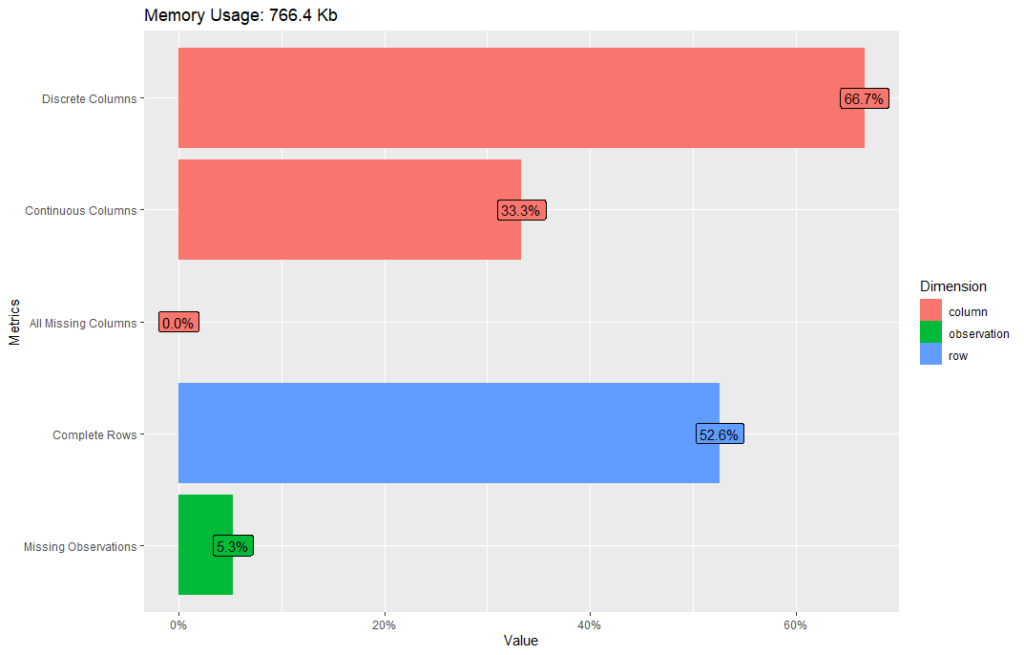
66.7% contains Discrete columns, 33.3% contains continuous columns.
52.6% contains complete rows and 5.3% contains missing observations.
All columns with missing values are 0%.
gss_cat %>% plot_missing()
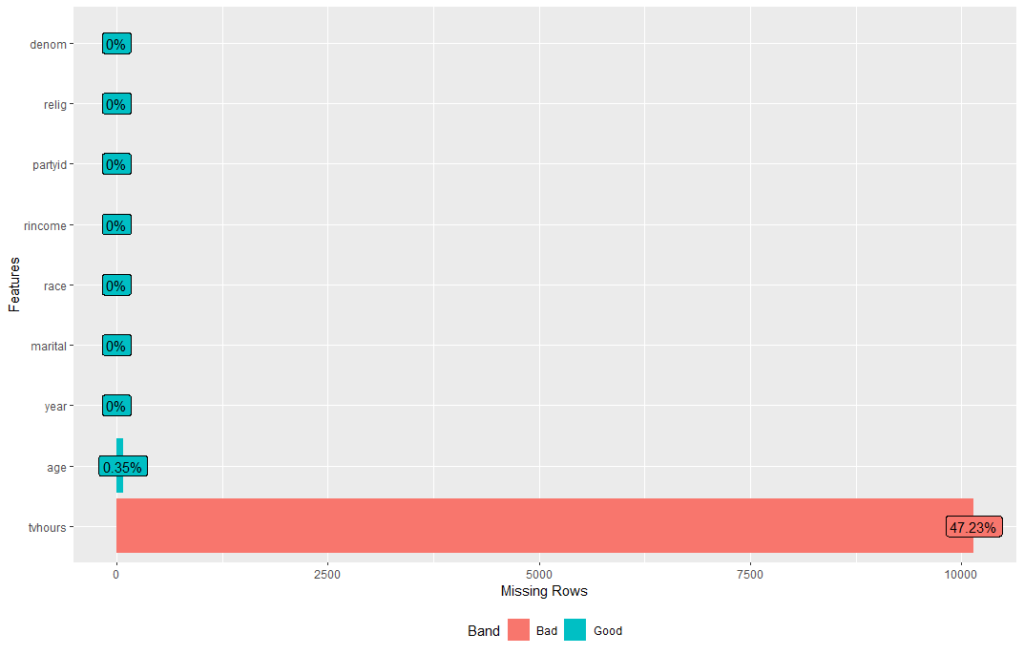
gss_cat %>% profile_missing()
# A tibble: 9 x 3
  feature num_missing pct_missing
  <fct>         <int>       <dbl>
1 year              0     0
2 marital           0     0
3 age              76     0.00354
4 race              0     0
5 rincome           0     0
6 partyid           0     0
7 relig             0     0
8 denom             0     0
9 tvhours       10146     0.472
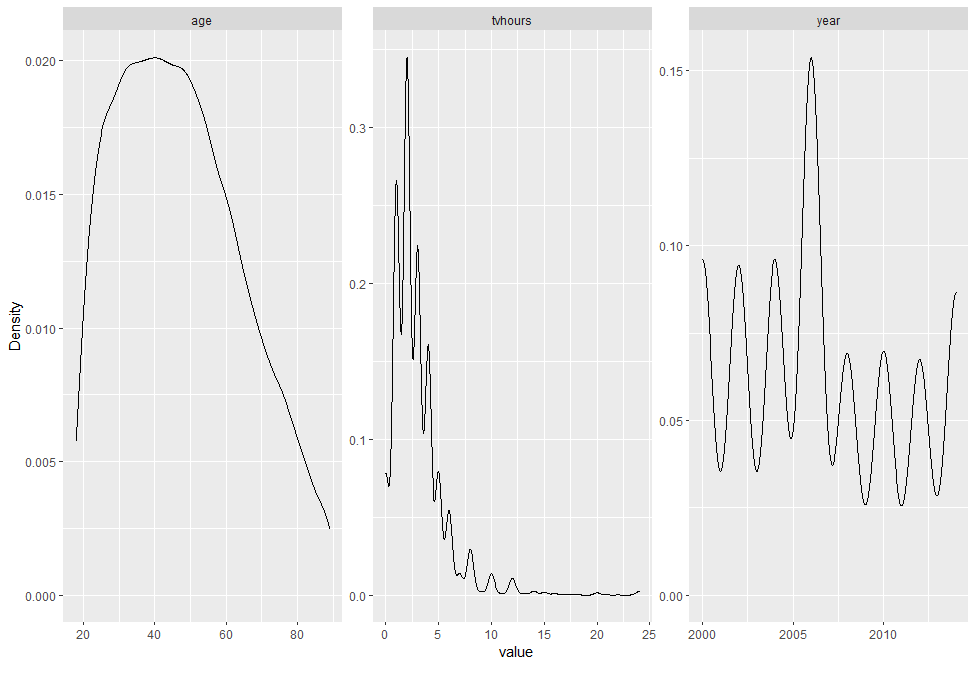
Density Plot
gss_cat %>% plot_density()
Linear Discriminant Analysis in R
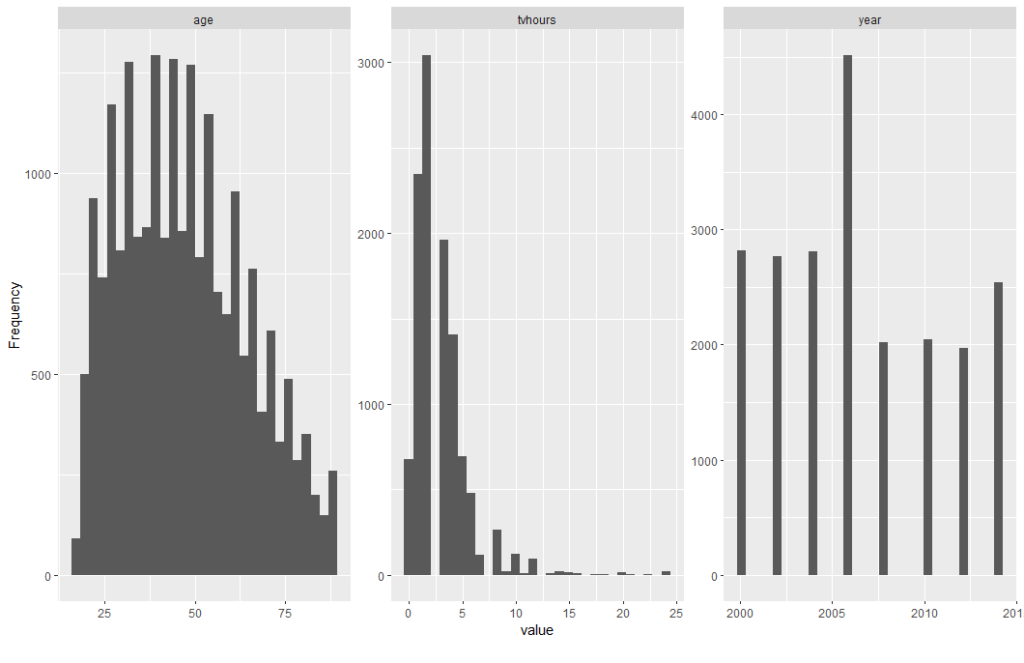
Histogram
gss_cat %>% plot_histogram()
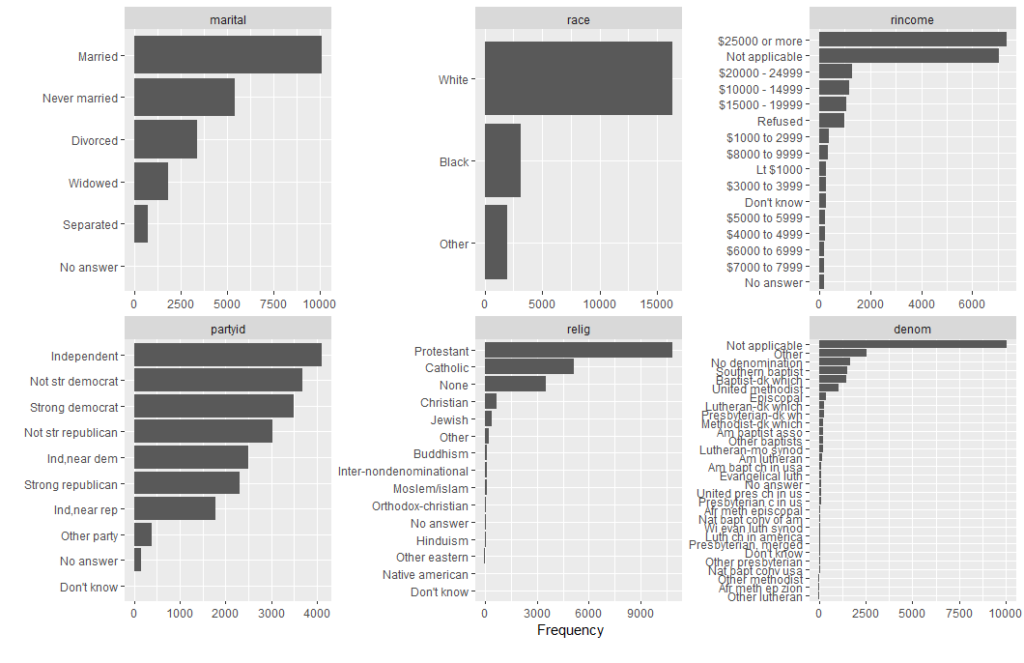
Bar Plot
gss_cat %>% plot_bar()
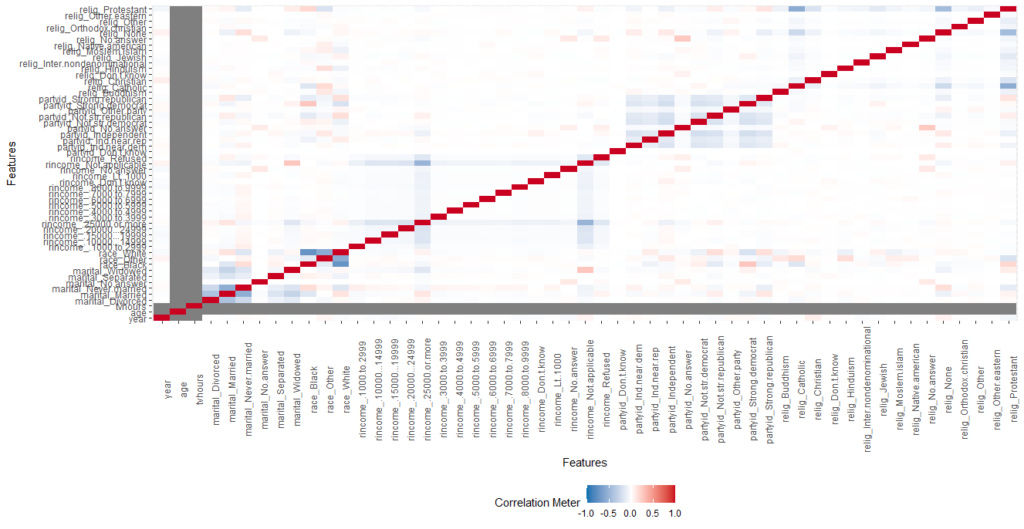
Correlation Plot
gss_cat %>% plot_correlation()
gss_cat %>% plot_correlation(maxcat = 5)
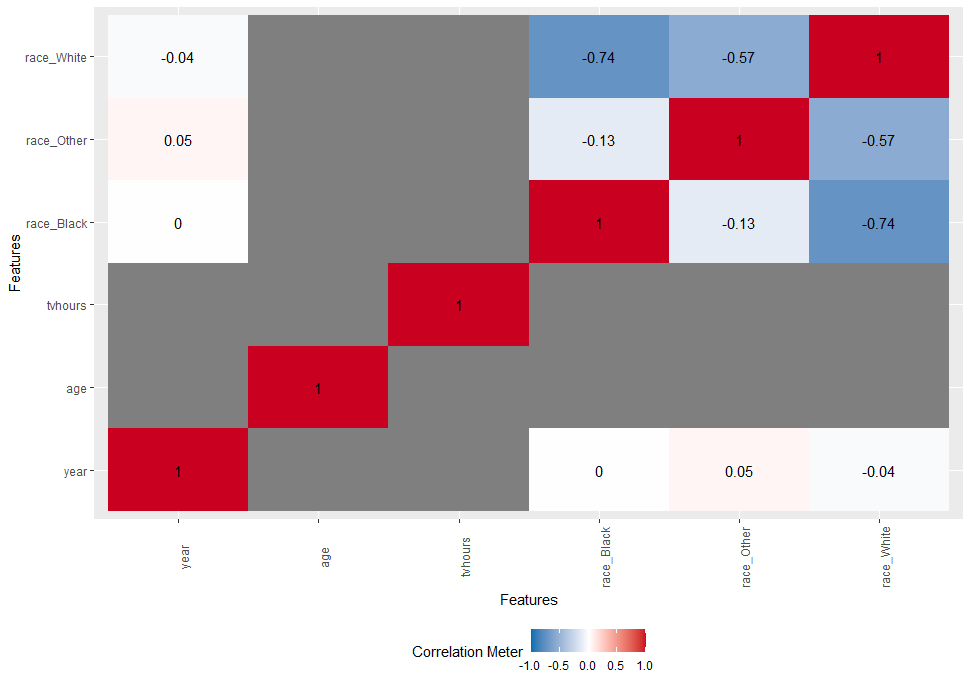
maxcat can adjust based on your variables and interest. You can make use Data Explorer package for quick checking before proceeding to further analysis.
For complete html report you can make use below mentioned codes.
gss_cat %>%
create_report(
output_file = "gss_survey_data_profile_report",
output_dir = "D:/RStudio/EDA/",
y="rincome",
report_title = "EDA Report"
)
Conclusion
Exploratory Data Analysis is an approach to identify every nuance from the data at the early encounter and its plays a crucial role in the data analysis field.


All these functions, but no mention of the package name. Why bother writing a post if the reader has to go and search where these functions are coming from?
css_ functions from the forcats package (tidyverse).
for the report generation below code you can make use of data explorer package
gss_cat %>%
create_report(
output_file = “gss_survey_data_profile_report”,
output_dir = “D:/RStudio/EDA/”,
y=”rincome”,
report_title = “EDA Report”
)
Thanks for your comments.
I don’t think you wanted the () in this section of the code:
Correlation Plot
gss_cat %>% plot_correlation()
Also, you have not included any library calls for Tidyverse and DataExplorer
Yes, without () we can execute and the library details updated. Thanks a lot…