Aesthetics must be either length 1 or the same as the data
Error: Aesthetics must be either length 1 or the same as the data, In this article, you’ll discover how to fix the R programming language error message ” Error: Aesthetics must be either length 1 or the same as the data”
When you try to define the fill colors to use in a ggplot2 plot, but the number of colors you specified is greater than 1 or less than the total number of objects to be filled, you’ll get this error.
First, we need to create a data frame and will create a bar graph.
To begin, we’ll need to create some data that we’ll later utilize in the examples.
data <- data.frame(x = LETTERS[1:10],  y = 1:10)
data
Let’s view the data frame.
1  A  1
2  B  2
3  C  3
4  D  4
5  E  5
6  F  6
7  G  7
8  H  8
9  I  9
10 J 10
If you don’t already have the ggplot2 package installed, you can use the install.packages() command to do so, and then load ggplot2 to R.
install.packages("ggplot2")
library("ggplot2")
First will reproduce the error, that is “Error: Aesthetics must be either length 1 or the same as the data”.
Will demonstrate how to reproduce the R error “Aesthetics must be either length 1 or the same as the data.”
We can create a barplot for the same.
ggplot(data, aes(x, y, fill = c("green", "black"))) +
  geom_bar(stat = "identity")
Error: Aesthetics must be either length 1 or the same as the data (10): fill Run `rlang::last_error()` to see where the error occurred.
As you can see, the RStudio console now displays the following error:
The reason for this is that the fill argument in the aes function has been set to a vector of length 2 (i.e. c(“red”, “blue”)).
However, because our example data comprises 10 categories, it is unclear which filling color should be used for each.
Let’s get this problem solved!
Solution
The ggplot2 error “Aesthetics must be either length 1 or the same as the data” is addressed below.
As previously said, each group in our data must have its own filling color. Setting fill to match our grouping variable (i.e. x) is the simplest method to do this.
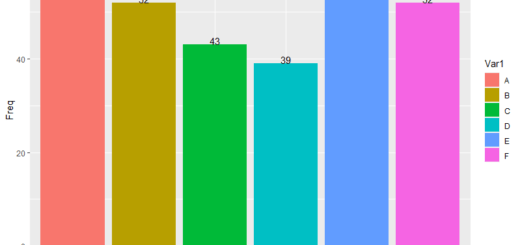
ggplot(data, aes(x, y, fill = x)) +
geom_bar(stat = "identity")

The graph is now presented in the R console, as you can see. Yes, we can remedy the issue using the fill command, or you may manually assign category colors in this situation, which requires a total of 10 colors.
Proportion test in R. How to do?, Conditions, Types of tests and inferences
Subscribe to our newsletter!