How to Overlay Plots in R-Quick Guide with Example
To make overlay Plots in R, we can make use of lines() and points() functions.
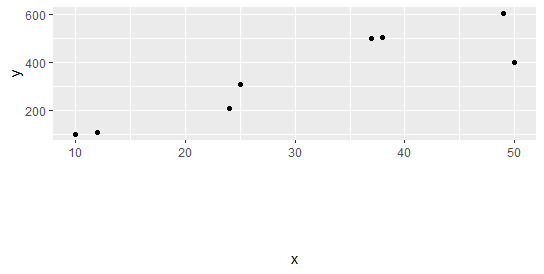
Let’s create a scatter plot first and overly another line plot.
Approach:-
#Step1:-create scatterplot
plot(x1, y1)
#Step 2:-overlay line plot
lines(x2, y2)
#Step3:-overlay scatterplot
points(x2, y2)
Let’s create an example,
Regression analysis in R-Model Comparison »
How to Overlay Line Plots
Let’s create a data set and overlay three-line plots in a single plot in R
#Create a datasets
x1 = c(5, 4, 3, 7, 8)
y1 = c(7, 10, 12, 17, 21)
x2 = c(4, 3, 7, 9, 12)
y2 = c(7, 12, 18, 18, 22)
x3 = c(4, 6, 1, 4, 12)
y3 = c(3, 8, 9, 12, 14)
#Create x1 vs y1 line plot
plot(x1, y1, type='l', col='blue', lty = 1,pch=19,lwd=1)

#overlay x2 vs y2 line plot
KNN Algorithm Machine Learning » Classification & Regression »
lines(x2, y2, col='green', lty = 1,pch=19,lwd=1)

#overlay x3 vs y3 line plot
lines(x3, y3, col='red', type = "b",lty = 1,pch=19,lwd=1)

#add legend
legend(8, 21, legend=c('Line 1', 'Line 2', 'Line 3'),col=c('blue', 'green', 'red'), lty=1)
Example 2: How to Overlay Scatterplots in R
Let’s see how to overlay two scatterplots in a single plot in R
Decision Trees in R » Classification & Regression »
#create a datasets
x1 = c(4, 7, 10, 12, 18)
y1 = c(4, 12, 18, 22, 27)
x2 = c(2, 5, 8, 9, 10)
y2 = c(6, 12, 19, 18, 25)
#create x1 vs y1 scatterplot
plot(x1, y1, col='blue', pch=19)

#overlay x2 vs y2 scatterplot
Kruskal Wallis test in R-One-way ANOVA Alternative »
points(x2, y2, col='red', pch=19)

#add legend
legend(14, 10, legend=c('x1 vs y1', 'x2 vs y2'), pch=c(19, 19), col=c('blue', 'red'))

Read more on pch here R Plot pch Symbols: Different point shapes in R »