ANOVA and Regression Models in Statistics
ANOVA (Analysis of Variance) and regression analysis are two of the most widely used statistical methods for analyzing relationships between variables. Both methods are fundamental to statistics, data science, research, and predictive analytics.
Although ANOVA and regression are often presented as separate techniques, they are closely related. In fact, ANOVA can be viewed as a special case of the linear regression model when categorical predictors are represented using indicator or dummy variables.
Understanding when to use ANOVA, regression, or a combination of both helps researchers select an appropriate statistical model and interpret results correctly.
What Are ANOVA and Regression Models?
Both ANOVA and regression models can be used when the response variable is continuous.
Examples of continuous response variables include:
- Weight
- Height
- Income
- Sales
- Product performance
- Plant growth
- Blood pressure
- Temperature
- Processing time
The primary difference is traditionally described in terms of the predictor variables.
ANOVA is commonly used to compare the mean response across categories, while regression is commonly used to quantify relationships between a response and one or more predictors.
However, this distinction is not absolute because regression models can also include categorical predictors.
Similarities Between ANOVA and Regression
ANOVA and regression share several important characteristics.
Both methods can:
- Model a continuous response variable.
- Evaluate relationships between predictors and an outcome.
- Test statistical hypotheses.
- Estimate effects of explanatory variables.
- Provide measures of unexplained variation.
- Be extended to multiple predictors.
- Use residual analysis to evaluate model assumptions.
Both approaches are also based on partitioning variation into components that can be attributed to the model and components that remain unexplained.
For example, both approaches can ultimately address a question such as:
Does the predictor variable provide statistically significant information about the response?
Key Difference Between ANOVA and Regression
The traditional distinction is based on the type of predictor.
ANOVA
ANOVA is primarily used when predictors are categorical.
Examples include:
- Fertilizer type
- Treatment group
- Education level
- Product formulation
- Region
- Machine type
Regression
Regression is commonly used when predictors are continuous.
Examples include:
- Age
- Income
- Temperature
- Advertising expenditure
- Square footage
- Production volume
However, regression can also include categorical predictors by representing categories using indicator variables.
Therefore, a more accurate distinction is:
ANOVA is primarily focused on comparing group means, whereas regression is primarily focused on estimating relationships and effects between predictors and a response.
Example 1: When to Use One-Way ANOVA
Imagine a biologist wants to determine whether four different fertilizers produce different average plant growth.
She applies each fertilizer to 20 plants and measures plant growth after one month.
The variables are:
Response variable:
Plant growth in inches.
Predictor variable:
Fertilizer type.
The fertilizer variable has four categories:
- Fertilizer 1
- Fertilizer 2
- Fertilizer 3
- Fertilizer 4
Because the objective is to compare the mean plant growth across four groups, a one-way ANOVA is appropriate.
The null hypothesis is: H0:μ1=μ2=μ3=μ4
The alternative hypothesis is: HA:At least one group mean differs
If the ANOVA p-value is less than the chosen significance level, such as 0.05, there is evidence that the average plant growth differs among at least some fertilizer groups.
A significant ANOVA result does not tell us which groups differ. A suitable post-hoc test, such as Tukey’s HSD, may then be used.
Example 2: When to Use Simple Linear Regression
Consider a real estate analyst who wants to investigate whether house size is associated with house price.
The analyst collects data for 200 houses, including:
- Square footage
- House price
Both variables are continuous.
A simple linear regression model can be written as: Price=β0+β1(Square Footage)+ϵ
where:
- β0 = intercept
- β1 = slope
- ϵ = random error
The coefficient β1 represents the expected change in house price associated with a one-unit increase in square footage, under the assumptions of the model.
For example, if: β1=250
the estimated average association would be an increase of ₹250 in house price for each additional square foot, assuming the model is appropriately specified.
Example 3: Multiple Regression With Categorical Variables
Suppose the real estate analyst wants to consider both:
- Square footage
- Home type
Home type contains three categories:
- Single-family
- Apartment
- Townhome
Regression can accommodate this categorical variable using indicator variables.
If Townhome is selected as the reference category, the model could be written as: Price=β0+β1(Square Footage)+β2(SingleFamily)+β3(Apartment)+ϵ
Here:
- SingleFamily = 1 for a single-family home and 0 otherwise.
- Apartment = 1 for an apartment and 0 otherwise.
- Townhome is represented by the reference category.
Interpreting the Regression Coefficients
β1: Square Footage
β1 represents the expected change in house price associated with a one-unit increase in square footage, holding home type constant.
β2: Single-Family
β2 represents the estimated difference in price between a single-family home and the reference category, townhome, holding square footage constant.
β3: Apartment
β3 represents the estimated difference between an apartment and a townhome, holding square footage constant.
ANOVA Can Be Expressed as Regression
One of the most important concepts to understand is that ANOVA and regression are not completely separate modeling frameworks.
Suppose we have: Yij=μ+αi+ϵij
for a one-way ANOVA.
The same problem can be represented using dummy variables in a regression model.
For example: Y=β0+β1D1+β2D2+β3D3+ϵ
where one group is used as the reference category.
The resulting hypothesis tests can be mathematically equivalent when the models are specified appropriately.
This means that ANOVA can be considered a special case of the general linear model.
ANOVA vs Regression: Quick Comparison
| Feature | ANOVA | Regression |
|---|---|---|
| Primary purpose | Compare group means | Estimate relationships/effects |
| Typical predictor | Categorical | Continuous and/or categorical |
| Response | Usually continuous | Continuous in linear regression |
| Example | Compare four fertilizers | Predict price from square footage |
| Multiple predictors | Yes | Yes |
| Categorical predictors | Natural | Use indicator/dummy coding |
| Continuous predictors | Can be incorporated into broader models | Natural |
| Interaction effects | Yes | Yes |
| Prediction | Less commonly emphasized | Common application |
| Coefficients | Group effects/mean differences | Slopes and effects |
What About ANCOVA?
There are situations where researchers have both categorical and continuous predictors.
For example, suppose a researcher wants to compare plant growth across fertilizer types while controlling for the initial plant height.
Here:
- Fertilizer type = categorical predictor
- Initial plant height = continuous predictor
- Final plant growth = response
This is commonly analyzed using ANCOVA (Analysis of Covariance).
The model might be: Growth=β0+β1(Fertilizer)+β2(InitialHeight)+ϵ
ANCOVA combines concepts from ANOVA and regression.
Two-Way ANOVA and Regression
Suppose a researcher studies the effect of:
- Fertilizer type
- Watering frequency
on plant growth.
A two-way ANOVA can evaluate:
- Fertilizer main effect
- Watering main effect
- Fertilizer × watering interaction
The same analysis can be represented using a regression model with indicator variables and interaction terms.
For example: Growth=β0+β1Fertilizer+β2Watering+β3(Fertilizer×Watering)+ϵ
This illustrates the close connection between ANOVA and regression.
When Should You Use ANOVA?
ANOVA is particularly useful when your primary research question is:
Do the average outcomes differ across groups?
Examples include:
- Do different drugs produce different mean responses?
- Do different teaching methods produce different exam scores?
- Do different product formulations produce different sensory scores?
- Do different fertilizers produce different plant growth?
- Do different manufacturing processes produce different average quality measurements?
When Should You Use Regression?
Regression is particularly useful when your research question is:
How is the response associated with one or more predictors, and how does the expected response change as the predictors change?
Examples include:
- How does house price change with square footage?
- How does sales change with advertising expenditure?
- How does product performance change with ingredient concentration?
- How does fuel consumption change with vehicle weight?
- How does customer spending change with income?
Regression is also commonly used when prediction is an important objective.
What If You Have Both Categorical and Continuous Predictors?
You do not necessarily need to choose between ANOVA and regression.
A general linear model can accommodate both.
For example: Y=β0+β1X+β2Group+ϵ
where:
- X is continuous.
- Group is categorical.
This allows you to compare groups while simultaneously adjusting for a continuous predictor.
Important Assumptions
For standard linear-model ANOVA and regression, several assumptions should be evaluated.
Independence
Observations should be independent according to the study design.
Linearity
For continuous predictors in a linear regression model, the relationship between the predictor and the expected response should be appropriately represented by the model.
Homogeneity of Variance
Residual variance should be reasonably constant across relevant levels of the predictors.
Residual Distribution
For inference in small samples, approximately normal residuals can be important.
No Severe Multicollinearity
When multiple predictors are included, strong relationships among predictors can make coefficient estimates unstable.
The appropriate assumptions depend on the exact model and research design.
Common Mistakes
Mistake 1: Thinking ANOVA and Regression Are Completely Different
They are closely related and can be represented within the general linear model framework.
Mistake 2: Believing Regression Is Only for Continuous Predictors
Regression models can include categorical variables through appropriate coding.
Mistake 3: Automatically Using ANOVA for Every Categorical Variable
The choice should be driven by the research question, model structure, and study design.
Mistake 4: Ignoring Interaction Effects
If the effect of one predictor depends on another predictor, an interaction term may be necessary.
Mistake 5: Interpreting Statistical Significance as Practical Importance
A statistically significant result does not necessarily imply a meaningful real-world effect.
Effect sizes and confidence intervals should also be considered.
ANOVA vs Regression: A Simple Decision Framework
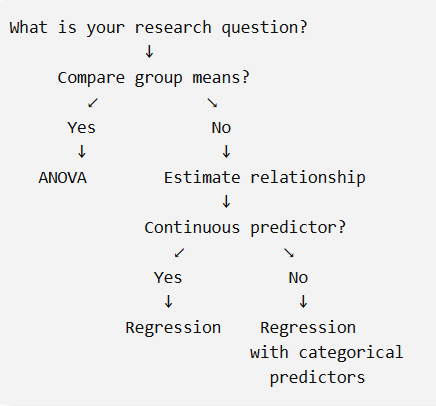
For problems involving both categorical and continuous predictors, consider the general linear model or ANCOVA rather than treating ANOVA and regression as mutually exclusive choices.
Conclusion
ANOVA and regression are closely connected statistical modeling approaches. ANOVA is commonly used to compare mean outcomes across categorical groups, while regression is commonly used to quantify relationships between a response and one or more predictors.
The distinction becomes less rigid when categorical predictors are represented using indicator variables. In fact, one-way and two-way ANOVA can be expressed as regression models, making both techniques part of the broader general linear model framework.
A useful rule of thumb is:
- Comparing group means → ANOVA
- Estimating relationships with continuous predictors → Regression
- Categorical + continuous predictors → ANCOVA or general linear model
- Multiple predictors and prediction → Multiple regression
- Factor interactions → ANOVA or regression with interaction terms
Ultimately, the best method is determined not simply by whether a variable is categorical or continuous, but by the research question, study design, predictor structure, assumptions, and desired interpretation.
Understanding the relationship between ANOVA and regression gives researchers a much more flexible foundation for statistical modeling and data analysis.