Rank Order analysis in R
Rank Order analysis in R!. What is mean by rank data?
Suppose we have k subjects and n number of volunteers, each volunteer asked to rank each subject.
The outcome will come into the form of ordered data, like R1, R2, R3, etc.
What is the minimum number of units in an experimental design
Objective
- To find out the significant difference exit or not
- To find out the optimal rank order list
- To find out the conditional probability of each subject
Rank Order analysis in R
Let’s upload relevant libraries and data points into R environment.
rm(list=ls())
library(RankAggreg)
library(e1071)
library(xlsx)
library(stringr)
data<-read.xlsx("D:/RStudio/Website/data.xlsx",sheetName="Sheet1")
head(data)
Outcome
CID Product Rank
5 A 1
1 B 1
6 C 1
1 D 1
1 E 1
1 A 2
Approach 1-Rank Aggregation
Rank aggregation help you to find the optimal rank order. In other way aggregation converts multi rank list into single rank list.
Brute aggregate is used for find out the optimal list.
Rank Aggregation-Rank Order analysis in R
data$Product<-toupper(data$Product)
colnames(data)<-c("CID","Product","Rank")
data<-data[order(data$Rank),]
wide2<-reshape(data,v.names="Product",idvar=c("CID"),timevar="Rank",direction="wide")
wide2<-as.matrix(wide2[,-1])
rownames(wide2)<-NULL
colnames(wide2)<-str_replace_all(colnames(wide2), pattern="Product.",repl="")
BruteAggreg(wide2,length(unique(data$Product)))
Output
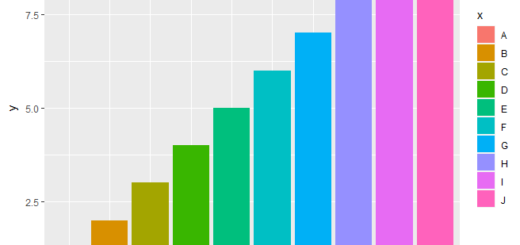
Optimal List
The optimal list is: A B C D E
Algorithm: BruteForce
Distance: Spearman
Score: 2.666667
Rank Aggregate Plot
Significance of Spearman’s Rank Correlation
Approach2- Contingency table analysis
Based on Fisher/Chi square method is used for identify the significance difference between products.
Contingency table provides the integer count for the measurements with respect to the categorical variables.
You can use compare group package here, for easy application, compare group will execute fisher exact or chi-square test automatically, depends on the number of contingency table cell frequencies.
dataA<-data[,c(-1)]
library(Hmisc)
ansA <- compareGroups(Product~ ., data = dataA,max.ylev = 30,max.xlev =15)
ansA <- update(ansA, method =3)
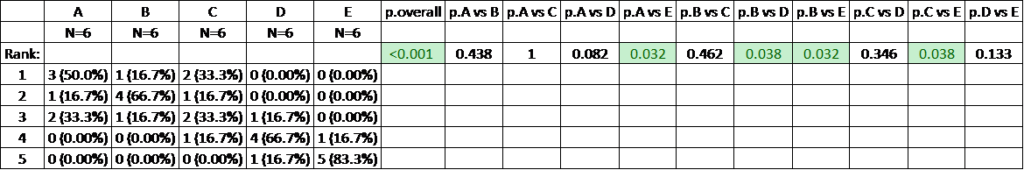
anstabA<-createTable(ansA,show.p.mul = TRUE)Output
Approach 3-Conditional Probability
If you try to calculate probability of a particular condition is called as conditional probability. In other words, Probability of happening of an event A when event B has already taken care.
The example of naive conditional probabilities are automatic identification of spam mails, rain prediction based on particular conditions etc…
Bayes theorem is P(A/B) = [p(B/A) * p(A)] / p(B)
naiveBayes(Rank ~., data=data)output
Product
Y A B C D E
1 0.5000000 0.1666667 0.3333333 0.0000000 0.0000000
2 0.1666667 0.6666667 0.1666667 0.0000000 0.0000000
3 0.3333333 0.1666667 0.3333333 0.1666667 0.0000000
4 0.0000000 0.0000000 0.1666667 0.6666667 0.1666667
5 0.0000000 0.0000000 0.0000000 0.1666667 0.8333333
Conclusion
Based on compare group analysis able to identify the significant difference between samples.
Significant difference was observed between A vs E, B vs D, B vs E, C vs E.
Based on Rank aggregation method able to identify the optimal order is A B C D E.
What is mean best Standard Deviation?

Now retrieving an image set.