Stocks to Buy this Week: NSE 500
Stocks to Buy this Week, Stock market investing is often viewed as a combination of skill, experience, and intuition. However, modern quantitative investing relies heavily on data, statistics, and systematic analysis rather than emotions or guesswork.
To identify stocks with strong short-term upside potential, we developed an advanced R-based stock screening and analysis framework that evaluated all stocks in the NSE 500 universe using multiple technical, momentum, volume, trend, and risk-analysis methodologies.
Stocks to Buy this Week
The objective was straightforward: analyze the entire NSE 500 index, identify stocks demonstrating strong technical characteristics, and shortlist only those with the highest probability of outperforming over the coming week. Rather than relying on a single indicator or strategy, the system combined multiple independent analytical techniques to create a comprehensive stock-ranking model.
After evaluating all NSE 500 constituents, approximately 200 stocks passed our initial screening criteria this week (Stocks to Buy this Week) and demonstrated sufficient technical strength to warrant further investigation. The shortlisted stocks were then ranked based on trend quality, momentum strength, volume confirmation, breakout potential, and risk-reward characteristics.
This article explains every major analytical technique used in our R-based stock analysis framework and how each contributed to the final stock recommendations.
Why Analyze the Entire NSE 500 Universe?
Many investors focus only on popular stocks or companies that frequently appear in financial news. While these stocks may offer opportunities, limiting analysis to a small group of stocks often causes investors to overlook emerging trends in other sectors.
The NSE 500 represents a broad cross-section of the Indian equity market and includes companies from multiple industries such as:
- Banking and Financial Services
- Information Technology
- Pharmaceuticals
- Energy
- Manufacturing
- Infrastructure
- Consumer Goods
- Automobile
- Chemicals
- Capital Goods
By analyzing all NSE 500 stocks (Stocks to Buy this Week), we allow the data to identify opportunities rather than relying on preconceived opinions.
Data Collection and Preparation for Stocks to Buy this Week
The first step involved collecting historical market data for all NSE 500 stocks.
The analysis framework retrieved:
- Daily Open Prices
- Daily High Prices
- Daily Low Prices
- Daily Closing Prices
- Trading Volume
- Historical Price Series
Data quality is critical because inaccurate data can lead to misleading conclusions. Missing values, duplicate records, and inconsistent trading information were removed before analysis began.
Once the data was cleaned, the R program calculated dozens of indicators and analytical metrics for every stock.
Moving Average Analysis
Moving averages form the foundation of trend analysis.
A moving average smooths daily price fluctuations and helps identify the underlying market direction.
The analysis calculated:
- 20-Day Moving Average
- 50-Day Moving Average
- 100-Day Moving Average
- 200-Day Moving Average
Why Moving Averages Matter
Professional investors often use moving averages to determine whether a stock is in an uptrend or downtrend.
Stocks trading above their:
- 20-Day Moving Average
- 50-Day Moving Average
- 200-Day Moving Average
generally indicate positive momentum and strong institutional participation.
Higher scores were assigned to stocks maintaining strength above multiple moving averages.
Golden Cross Detection
The system also identified Golden Cross formations.
A Golden Cross occurs when the 50-day moving average rises above the 200-day moving average.
Historically, this pattern is associated with improving long-term market sentiment and potential future strength.
Stocks displaying Golden Cross characteristics received additional ranking points.
Relative Strength Index (RSI) Analysis
RSI measures momentum and helps identify whether a stock is gaining or losing strength.
The RSI scale ranges from 0 to 100.
General interpretation:
- Below 30 = Oversold
- Above 70 = Overbought
However, professional traders understand that strong stocks can remain overbought for extended periods.
Instead of using RSI as a buy-or-sell trigger, we used it as a momentum confirmation tool.
Stocks with healthy RSI readings and improving momentum received higher scores.
MACD Analysis
The Moving Average Convergence Divergence (MACD) indicator was another key component of the screening system.
MACD measures momentum shifts and trend acceleration.
The analysis evaluated:
- MACD Line
- Signal Line
- Histogram Strength
Bullish MACD crossovers often indicate increasing buying pressure.
Stocks showing positive MACD alignment were considered stronger candidates than stocks displaying weakening momentum.
Bollinger Bands Analysis
Bollinger Bands measure market volatility and help identify potential breakout opportunities.
The framework analyzed:
- Upper Bollinger Band
- Lower Bollinger Band
- Bollinger Band Width
Volatility Compression
One particularly important signal is volatility compression.
When Bollinger Bands narrow significantly, it indicates reduced volatility.
Historically, periods of low volatility are often followed by strong directional price movements.
Stocks showing volatility compression with improving momentum were flagged for potential breakout opportunities.
Volume Analysis
Volume is one of the most important indicators used by institutional investors.
Price movements without volume confirmation are often unreliable.
Our R-based framework calculated:
- Average Volume
- Relative Volume
- Volume Breakouts
- Accumulation Signals
Institutional Activity Detection
Large institutions cannot buy millions of shares without affecting trading volume.
As a result, unusual increases in volume often reveal institutional accumulation.
Stocks experiencing:
- Rising prices
- Increasing volume
- Consistent buying activity
received significantly higher rankings.
On-Balance Volume (OBV)
On-Balance Volume helps determine whether money is flowing into or out of a stock.
The indicator combines price movement and volume data.
Why OBV Matters
A stock may appear stable on the surface while institutions quietly accumulate shares.
Rising OBV often indicates accumulation before significant price advances.
Stocks with positive OBV trends were considered stronger candidates.
Trend Strength Analysis
Trend strength was evaluated using multiple factors.
The system measured:
- Slope of Moving Averages
- Price Position Relative to Trend
- Momentum Acceleration
- Multi-Timeframe Trend Alignment
Stocks exhibiting strong and consistent upward trends scored highest.
Weak or inconsistent trends were penalized.
Support and Resistance Analysis
Support and resistance levels are critical components of technical analysis.
Support Levels
Support represents areas where buying pressure historically emerges.
Stocks trading near support often offer attractive risk-reward setups.
Resistance Levels
Resistance represents areas where selling pressure historically appears.
The framework identified:
- Historical Resistance Levels
- Breakout Zones
- Recent Highs
Stocks approaching breakout levels received additional attention because successful breakouts often lead to rapid price appreciation.
Breakout Detection
One of the primary objectives of the screening model was identifying stocks likely to experience breakout moves.
The analysis searched for:
- New Highs
- Resistance Breakouts
- Consolidation Breakouts
- Volume-Confirmed Breakouts
Breakouts accompanied by strong volume typically have higher probabilities of success.
Therefore, volume confirmation played a major role in the ranking process.
Average True Range (ATR) Analysis
ATR measures market volatility.
Stocks with extremely low volatility often lack trading opportunities.
Conversely, stocks with excessive volatility may carry elevated risk.
The framework used ATR to:
- Measure trading risk
- Estimate price movement potential
- Calculate position sizing considerations
Stocks demonstrating favorable volatility characteristics received higher rankings.
Relative Strength Ranking
One of the most effective methods for finding market leaders is relative strength analysis.
Rather than evaluating stocks in isolation, we compared each stock’s performance against the broader market.
The system ranked stocks according to:
- Price Performance
- Trend Persistence
- Market Outperformance
Stocks consistently outperforming the broader market were prioritized.
Historically, market leaders tend to continue leading during favorable market conditions.
Risk Assessment
Risk management is often overlooked by retail investors.
A stock with strong upside potential may still be unsuitable if risk levels are excessive.
The framework evaluated:
- Historical Volatility
- Drawdown Characteristics
- Trend Stability
- Risk-Reward Ratios
Stocks demonstrating favorable risk-adjusted profiles received higher scores.
Composite Scoring System
After calculating dozens of technical indicators and analytical metrics, the system created a composite score for each stock.
The score incorporated:
- Trend Quality
- Momentum Strength
- Volume Confirmation
- Breakout Potential
- Volatility Characteristics
- Relative Strength
- Risk Profile
This approach prevented any single indicator from dominating the ranking process.
Instead, stocks needed to demonstrate strength across multiple categories to achieve high rankings.
Shortlisting 200 Stocks from NSE 500: Stocks to Buy this Week
The initial NSE 500 universe contained approximately 500 stocks.
After applying our screening criteria:
- Weak trends were eliminated.
- Stocks below major moving averages were removed.
- Negative momentum stocks were excluded.
- Poor volume profiles were rejected.
- Weak relative strength stocks were filtered out.
Approximately 200 stocks remained after this process.
These stocks demonstrated stronger technical characteristics compared with the broader market.
Buy, Hold, and Watchlist Recommendations
The shortlisted stocks were categorized into three groups.
Stocks to Buy this Week
These stocks displayed:
- Strong trends
- Positive momentum
- Volume confirmation
- Breakout potential
Hold Candidates
These stocks remained technically healthy but lacked immediate breakout signals.
Watchlist Candidates
These stocks exhibited promising characteristics but required additional confirmation before becoming high-conviction opportunities.
Why Multiple Indicators Are Better Than One
Many investors rely on a single indicator such as RSI or MACD.
This approach often leads to inconsistent results.
No individual indicator works effectively under all market conditions.
By combining:
- Trend Analysis
- Momentum Analysis
- Volume Analysis
- Volatility Analysis
- Relative Strength Analysis
- Breakout Detection
the system produces more robust and reliable rankings.
Limitations of Stock Prediction
Although advanced analytics can improve decision-making, no model can predict future stock prices with complete certainty.
Unexpected events such as:
- Earnings surprises
- Economic announcements
- Interest rate decisions
- Geopolitical developments
- Regulatory changes
can influence stock prices significantly.
For this reason, the system should be viewed as a probability-based decision-support framework rather than a guaranteed forecasting tool.
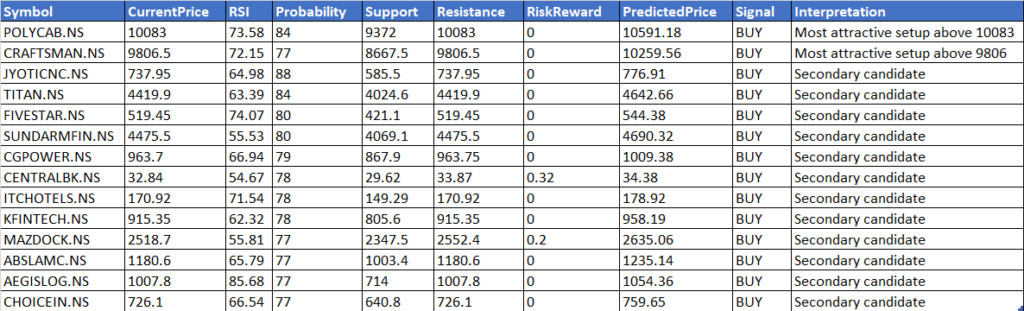
Basis stock analysis (06/21/2026) top 20 stocks displayed below:
Conclusion
Analyzing the entire NSE 500 universe using R enables investors to move beyond subjective opinions and focus on data-driven decision-making. By combining moving averages, RSI, MACD, Bollinger Bands, volume analysis, OBV, trend strength, support and resistance analysis, breakout detection, ATR, relative strength rankings, and risk management principles, the screening framework identifies stocks demonstrating superior technical characteristics.
From an initial universe of 500 stocks, approximately 200 stocks satisfied the screening criteria and displayed stronger momentum, trend quality, volume confirmation, and risk-adjusted potential than the broader market. These shortlisted stocks form the foundation for further investment research and portfolio construction.
While no methodology can guarantee future returns, systematic analysis significantly improves the ability to identify high-probability opportunities and helps investors make more disciplined, evidence-based investment decisions.
If need update on the same weekly stocks, please comment below.