Quadratic Regression Analysis in SPSS
Quadratic Regression Analysis in SPSS, Quadratic regression is a powerful statistical technique used to model the relationship between a dependent variable and one or more independent variables when the relationship is curvilinear.
Quadratic Regression Analysis in SPSS
This guide focuses on how to perform quadratic regression analysis in SPSS, providing step-by-step instructions, key interpretations, and practical insights.
Understanding Quadratic Regression
Quadratic regression is an extension of linear regression that includes a quadratic term (the square of the independent variable) to better fit a curved relationship.
The general form of a quadratic equation can be expressed as:
[ Y = a + bX + cX^2 ]
Where:
- ( Y ) = dependent variable
- ( X ) = independent variable
- ( a, b, c ) = coefficients
This polynomial approach allows researchers to capture phenomena that exhibit a non-linear pattern, providing insights that traditional linear regression cannot offer.
Why Use Quadratic Regression?
- Modeling Complexity: Many real-world relationships are not linear; quadratic regression can better represent these complexities.
- Prediction Accuracy: Including a quadratic term often improves the accuracy of predictions, as it allows for the curvature in trends.
- Insightful Analysis: Quadratic regression helps in identifying maximum and minimum points, offering deeper insights into data behavior.
Step-by-Step Guide to Performing Quadratic Regression in SPSS
Step 1: Prepare Your Data
Before running a quadratic regression, ensure your data is well-organized in SPSS:
- Open SPSS and load your dataset.
- Identify your dependent variable (the outcome you want to predict) and your independent variable (the predictor influencing the outcome).
Step 2: Create the Quadratic Term
To perform quadratic regression, you need to create a new variable representing the square of your independent variable:
- Go to the Transform menu.
- Click on Compute Variable.
- In the Target Variable box, name your new variable (e.g.,
X_squared). - In the Numeric Expression box, enter the expression to square your independent variable (e.g.,
independent_var^2). - Click OK to create the new variable.
Step 3: Perform the Regression Analysis
Now that you have both your independent variable and its square, you can perform the regression analysis:
- Navigate to the Analyze menu.
- Select Regression and then choose Linear.
- In the dialog box, move your dependent variable to the Dependent box.
- Move both your independent variable and the newly created quadratic term to the Independent(s) box.
- Click on Statistics, and ensure that options such as Estimates, Confidence intervals, and R squared change are checked.
- Click OK to run the regression.
Step 4: Interpret the Output
The output will provide several key statistics:
- Coefficients Table: This will show the coefficients for the independent variable and its square, allowing you to understand their impact on the dependent variable.
- R-squared Value: Indicates the proportion of variance in the dependent variable that can be explained by the independent variables. A higher value suggests a better fit.
- Significance Levels: Check the p-values in the coefficients table to determine if the relationships are statistically significant (typically, a p-value of less than 0.05 is considered significant).
Step 5: Make Predictions and Plot the Results
To visualize your quadratic regression model:
- Use the predicted values generated by SPSS.
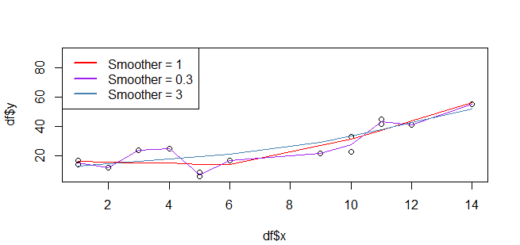
- Create scatter plots to illustrate the relationship and overlay the quadratic regression line.
- This provides a clear visual representation of the model and the fit of the data.
Conclusion
Quadratic regression analysis in SPSS is a robust tool for exploring non-linear relationships within your data.
By following the outlined steps, researchers can effectively model complex behaviors, enhance prediction accuracy, and gain valuable insights.
Whether you’re in academia, business, or any field relying on data analysis, understanding quadratic regression can significantly elevate your analytical prowess.
Don’t hesitate to leverage SPSS’s powerful features to explore and visualize your data—unlocking new avenues for interpretation and decision-making.
For more details and advanced analytics techniques, consider exploring additional resources or training programs that specialize in statistical methods in SPSS.


