Data Science with R Must-Read Books
Data Science with R, Master R Programming for Data Science: 10 Exceptional Free Resources
Are you eager to become proficient in R programming and harness its capabilities for data science?
Whether you’re a newcomer or an advanced programmer aiming to sharpen your skills, we have compiled a list of 10 outstanding free resources to help you excel in R and its applications in data analysis.
Dive into these materials to enhance your understanding of R and open the door to a successful career in data science.
1. R Programming for Data Science by Roger D. Peng
This comprehensive guide presents the foundational aspects of R programming with an emphasis on data science applications.
Renowned author Roger D. Peng covers essential topics such as data manipulation, cleaning, and visualization.
The book also touches on advanced programming concepts, making it a valuable resource for both beginners and intermediate users.
2. R for Data Science (2nd Edition) by Hadley Wickham, Mine Çetinkaya-Rundel, and Garrett Grolemund
As an essential read for aspiring data scientists, this book spans the entire data science workflow—from data import and tidying to transformation, visualization, and modeling.
Authored by Hadley Wickham, the creator of the tidyverse, this updated second edition incorporates the latest advancements in the R ecosystem, providing practical examples and clear explanations.
3. BBC Visual and Data Journalism Cookbook for R Graphics
This unique resource from the BBC data team delivers practical recipes for creating compelling data visualizations.
Covering various chart types and design techniques, this cookbook format allows for quick solutions to visualization challenges while imparting best practices for presenting data effectively.
4. Forecasting: Principles and Practice by Rob J Hyndman and George Athanasopoulos
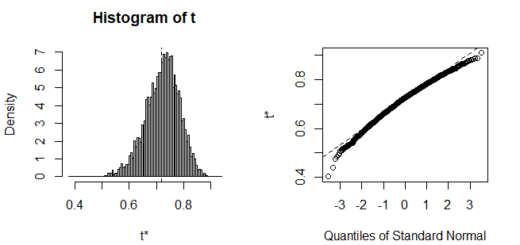
Focusing on forecasting methods using R, this textbook is ideal for those interested in time series analysis and predictive modeling.
The authors provide clear theoretical explanations accompanied by practical R examples, ensuring a comprehensive understanding of various forecasting techniques.
5. R Graphics Cookbook (2nd Edition) by Winston Chang
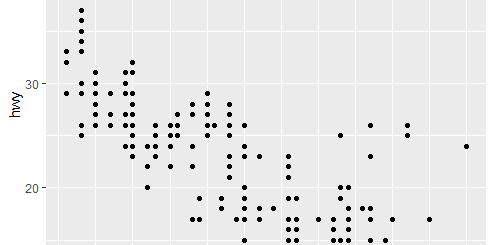
With more than 150 recipes, this practical guide helps users create high-quality graphs in R without wading through complex details.
Focusing on the ggplot2 package, the book addresses a variety of topics—from basic plots to advanced techniques—making it suitable for both novices and seasoned R users.
6. An Introduction to Statistical Learning (R Applications) by Gareth James, Daniela Witten, Trevor Hastie, and Robert Tibshirani
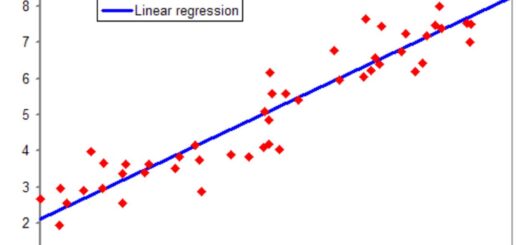
Offering an accessible introduction to statistical learning methods, this book covers topics like linear regression and classification, complemented by R-based labs and exercises.
It’s an excellent resource for anyone seeking to apply statistical theories using R, with a focus on practical implementation.
7. Hands-On Programming with R by Garrett Grolemund
This beginner-friendly book introduces R programming through engaging, simple projects.
Covering fundamentals like data structures and control flow, Grolemund’s approach is designed specifically for newcomers with no prior programming experience, laying a solid foundation for future data science endeavors.
8. Statistical Inference via Data Science: A ModernDive into R and the Tidyverse by Chester Ismay and Albert Y. Kim
Combining statistical inference with practical applications in R, this book utilizes the tidyverse framework for a modern approach to statistics.
The text is enriched with real-world examples and hands-on exercises, making it an excellent choice for learners looking to integrate statistical concepts with R programming.
9. Statistical Rethinking with brms, ggplot2, and the Tidyverse by A. Solomon Kurz
This innovative reimagining of Richard McElreath’s work emphasizes Bayesian statistics and multilevel models using R packages like brms and ggplot2.
The book features clear explanations paired with practical examples, ideal for readers interested in advanced statistical methods and contemporary R techniques.
10. Advanced R (2nd Edition) by Hadley Wickham
Aimed at experienced R programmers, this book explores advanced topics such as functional programming and object-oriented programming.
Accompanied by the Advanced R Solutions companion book, it provides worked solutions to exercises, creating an in-depth resource for mastering the intricacies of R programming.
Start Your R Programming Journey Today
With this carefully curated selection of resources, you can elevate your R programming skills from basic concepts to advanced techniques in data analysis.
Each resource is designed to offer valuable insights into data manipulation, visualization, statistical analysis, and machine learning.
By engaging with these materials, you’ll gain the practical experience and knowledge required to thrive in the data science field.
Embark on your R programming adventure today and unlock the possibilities embedded in data science!
Free Data Science Books » EBooks » FINNSTATS
Now retrieving an image set.