View data frame in r: use of View() function in R
View data frame in r, within RStudio, the View() function in R can be used to call a spreadsheet-style data viewer.
The syntax for this function is as follows:
Principal Component Analysis in R » finnstats
View(data)
When using this function, make sure to use a capital “V”.
The example below demonstrates how to utilize this syntax in practice.
How to Create a Covariance Matrix in R » finnstats
What Is the View() Function and How Do I view data frame in r?
To make a data frame in R with 500 rows and 2 columns, use the following code:
We can make this example reproducible while utilizing set.seed function
Research Analyst Vacancy (NY) » finnstats
set.seed(454)
Let’s create a data frame using rnorm function.
data <- data.frame(x=rnorm(500),y=rnorm(500))
The View() function can then be used to open a spreadsheet-style data viewer in RStudio.
View(data)
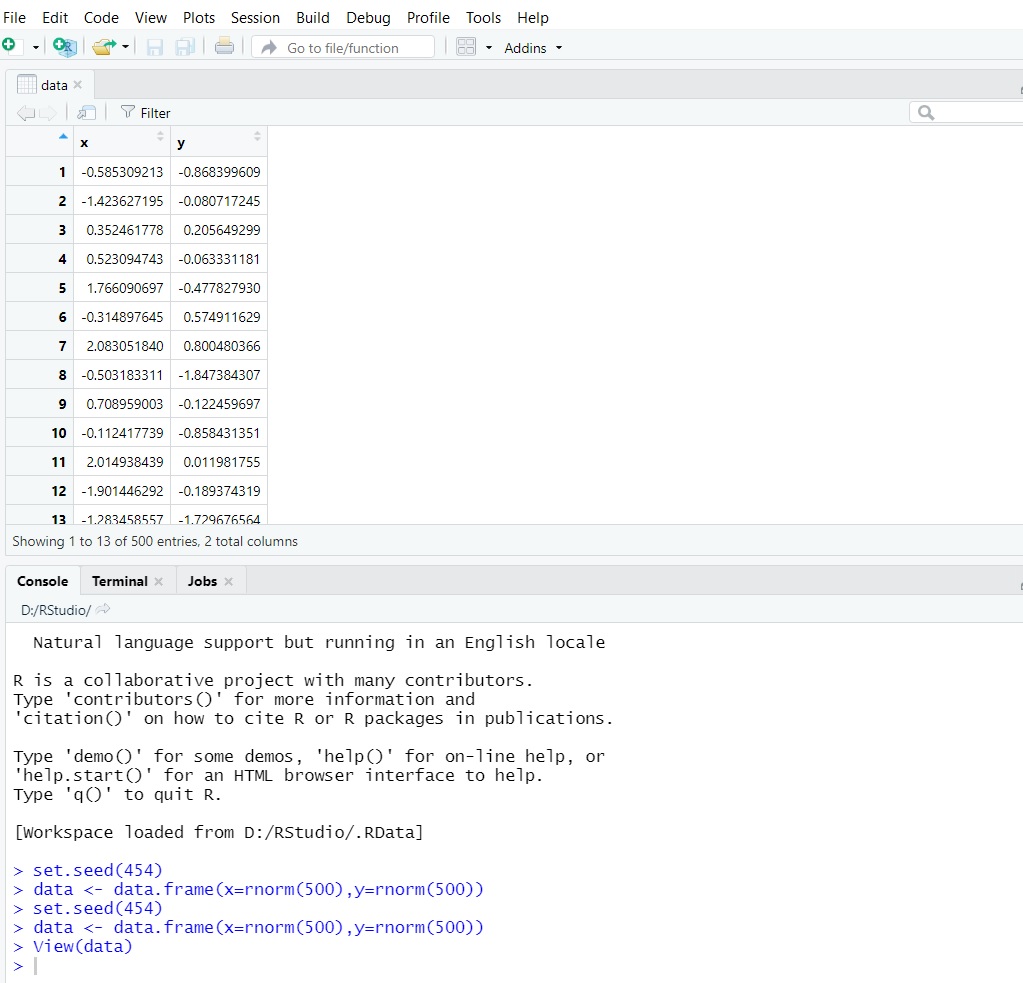
In Rstudio, you’ll see a new tab that enables an interactive representation of the data frame we just created.
Bagging in Machine Learning Guide » finnstats
The size of the data frame may be seen at the bottom of the viewer: There are 500 entries (rows) and two columns.
Using the View() Function to Sort Data
By clicking on one of the columns, we can easily sort the data set.
If we click on the column x header, for example, the data frame’s rows will be automatically sorted from least to largest depending on the values in column x.

If we click on the column x heading again, the data frame will be sorted from largest to smallest by column x.
How to Use the View() Function to Filter Data
I can also filter the data frame fast by clicking the Filter button, then clicking one of the column names, and then entering a range of values.
Reinforcement Learning in Machine Learning » finnstats
For instance, we could filter the data frame to only display rows with x between 0 and 1:

Once we press enter, the data frame will automatically be filtered.

At the bottom of the screen, we can see that 173 rows have values in the x column between 0 and 1.
Note that we can also add a filter in the y column to filter by specific values in both x and y.