Skewness in Statistics-Calculate Skewness in R
Skewness in Statistics, what is mean by skewness?
The lack of symmetry of the tails of a frequency distribution curve is known as skewness. The symmetry of tails means that the frequency of the points at equal distances on both sides of the center of the curve on the X-axis is the same.
The area under the curve at equidistant intervals on both sides of the center is also equal. Departure from symmetry leads to skewness.
It is adjusted by the elongation of the right and left tails of the curve.
datatable editor-DT package in R » Shiny, R Markdown & R »
What is the Positive and negative skewness in statistics?
If the left tail of the frequency curve is extra elongated than the right tail, it’s far referred to as negative skewness and the opposite case leads to positive skewness.
What purpose is served?
A measure of skewness indicates to what extent and in the direction the distribution of a variable is different from the symmetry of a frequency curve.
The curve may have positive or negative skewness.
Both positive and negative skewness can in no way arise simultaneously.
What is statistical data? Functions, Methods, and Types »
What happened to central tendency measures of skewness occurs?
In a negative skew curve, the mean and median are pulled to the left whereas, in a positive skew curve, the mean and median are pulled to the right.
Also, it should be kept in mind that the median always lies in between the mean and mode.
How can we know about skewness?
Skewness can be measured based on two methods graphically and mathematically. The graphical method is just enough to know the skewness. But it does not judge the extent of the skewness.
tidyverse in r – Complete Tutorial » Unknown Techniques »
Let’s see how to calculate skewness in R?
Load Library
library(moments)
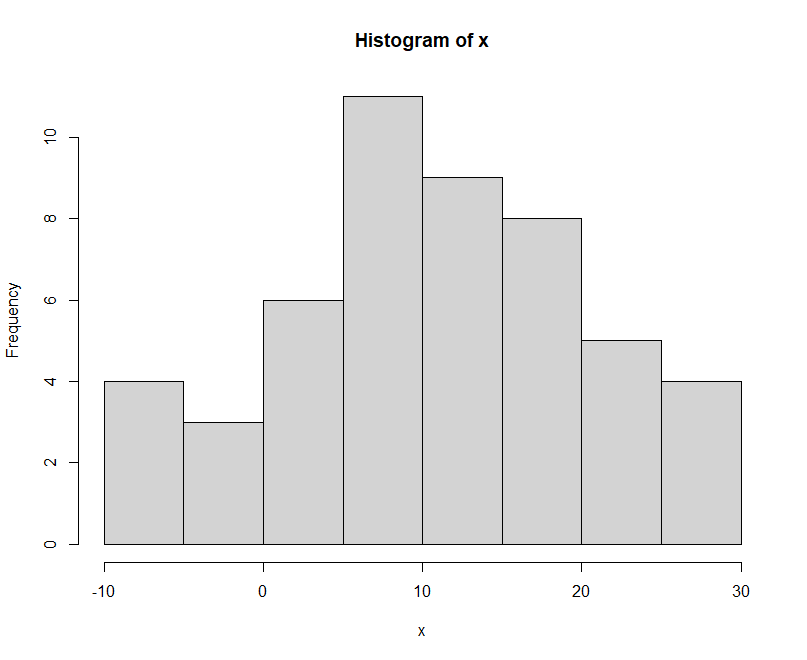
Zero Skewness (Symmetric)
If the coefficient of skewness is equal to 0 or approximately close to 0 then said to be symmetric and data is normally distributed.
x <- rnorm(50, 10, 10)
Skewness of distribution
skewness(x)
-0.07153909
Histogram of distribution
hist(x)
Decision Trees in R » Classification & Regression »
Positive Skewed
If the coefficient of skewness is greater than 0 then said to be positively skewed.
# Data
x <- c(30, 31, 32, 33, 40)
Skewness of distribution
skewness(x)
0.3221274
Histogram of distribution
hist(x)

Principal component analysis (PCA) in R »
Negatively skewed
If the coefficient of skewness is less than 0 then said to be negatively skewed.
x <- c(20, 21, 31, 28, 32, 33, 35)
Skewness of distribution
skewness(x)
-0.5722041
Histogram of distribution
hist(x)

KNN Algorithm Machine Learning » Classification & Regression »

