ggplot2 Transparent Background Quick Guide
ggplots Transparent Background, the ggplot2 syntax for adding a translucent background to a plot is as follows.
p +
  theme(
    panel.background = element_rect(fill='transparent'), #transparent panel bg
    plot.background = element_rect(fill='transparent', color=NA), #transparent plot bg
    panel.grid.major = element_blank(), #remove major gridlines
    panel.grid.minor = element_blank(), #remove minor gridlines
    legend.background = element_rect(fill='transparent'), #transparent legend bg
    legend.box.background = element_rect(fill='transparent') #transparent legend panel
  )
Make sure to indicate that the backdrop should be translucent when exporting the plot with ggsave().
ggsave('myplot.png', p, bg='transparent')The usage of this syntax in practice is demonstrated by the example that follows.
How to Use ggplot2 Transparent Background
The ggplot2 code below demonstrates how to make a straightforward grouped boxplot:
library(ggplot2)
Make this illustration repeatable
set.seed(123)
Now we can create a dataset
df<- data.frame(team=rep(c('P1', 'P2', 'P3'), each=50),
program=rep(c('LOW', 'MEDIUM'), each=25),
values=seq(1:150)+sample(1:100, 150, replace=TRUE))
head(df)
team program values
1   P1     LOW     84
2   P1     LOW     58
3   P1     LOW     42
4   P1     LOW     72
5   P1     LOW      6
6   P1     LOW     46
Yes, let’s create a boxplot
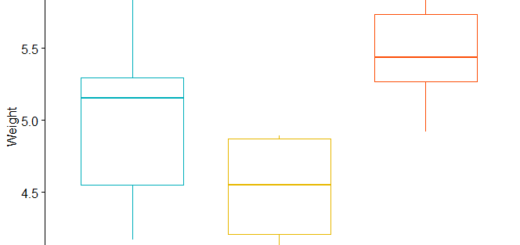
ggplot(df, aes(x=team, y=values, fill=program)) +
  geom_boxplot()

To give the plot a transparent background, we can use the following code.
p <- ggplot(df, aes(x=team, y=values, fill=program)) +
       geom_boxplot() +
       theme(
         panel.background = element_rect(fill='transparent'),
         plot.background = element_rect(fill='transparent', color=NA),
         panel.grid.major = element_blank(),
         panel.grid.minor = element_blank(),
         legend.background = element_rect(fill='transparent'),
         legend.box.background = element_rect(fill='transparent')
       )
Now we can display the boxplot
p

We can then export this plot to a PNG file, specifying that the background should be transparent in the exported image.
ggsave(‘boxplot.png’, p, bg=’transparent’)