Creating Relative Frequency in R
Creating Relative Frequency in R, also known as frequency tables, are an essential tool in data analysis.
They help us understand the distribution of data in a dataset by providing the number of occurrences (frequency) of each unique value within a specific variable.
Additionally, they allow us to calculate the relative frequency, which is the proportion of the total number of observations that have a particular value.
In this article, we will explore how to create relative frequency tables in R using a dataset and various examples.
Causal Conclusions and Control of Confounding Variables (finnstats.com)
Prerequisites
Before diving into the process, ensure you have R installed on your computer and have a basic understanding of R programming.
You will also need the ‘tidyverse’ package, which can be installed using the following command:
install.packages("tidyverse")Creating Relative Frequency Tables in R
Step 1: Load the Required Packages
In this tutorial, we will use the ‘tidyverse’ package, which includes several useful libraries for data manipulation and visualization.
Load the necessary libraries using the following command:
library(tidyverse)
Step 2: Import the Dataset
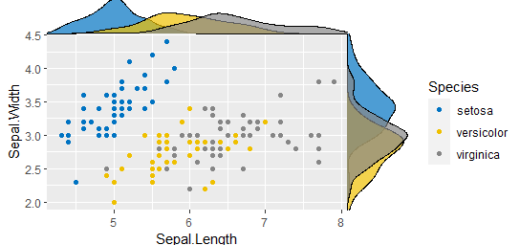
For this example, we will use the ‘iris’ dataset, which is a built-in dataset in R containing measurements of different iris flowers.
Load the dataset using the following command:
data(iris)
Step 3: Select the Variable for Analysis
Let’s say we want to create a relative frequency table for the ‘Species’ variable, which contains information about the type of iris (setosa, versicolor, or virginica).
Select the variable using the following command:
species <- iris$Species
Step 4: Count the Frequency of Each Unique Value
To create a frequency table, we first need to count the number of occurrences for each unique value in the ‘species’ variable.
We can achieve this using the ‘table()’ function in R:
species_freq <- table(species)
Step 5: Calculate the Relative Frequency
Now that we have the frequency of each unique value, we can calculate the relative frequency by dividing the frequency by the total number of observations. In R,
we can do this using the ‘prop.table()’ function:
species_rel_freq <- prop.table(species_freq, 1)
Step 6: Create the Relative Frequency Table
Finally, we can combine the frequency and relative frequency to create the relative frequency table.
We will use the ‘as.data.frame()’ function to convert the result into a data frame, which is easier to work with:
relative_freq_table <- as.data.frame(species_rel_freq)
Step 7: View the Relative Frequency Table
To view the relative frequency table, simply print it using the following command:
print(relative_freq_table)
Example Output:
            species Freq.  Rel.Freq.
1 setosa      50 0.3333333 0.3333333
2 versicolor  50 0.3333333 0.3333333
3  virginica  50 0.3333333 0.3333333
In this example, we have created a relative frequency table for the ‘Species’ variable in the ‘iris’ dataset.
The table shows that each species appears 50 times, which accounts for 33.33% of the total dataset.
Checking Missing Values in R » Data Science Tutorials
Conclusion
Creating relative frequency tables in R is a straightforward process that can provide valuable insights into your data.
By following these steps and using the provided examples, you can easily create relative frequency tables for various variables in your dataset. Remember to adapt this process to your specific needs and data structures.