How to Find Quartiles in R?
How to Find Quartiles in R, A dataset is divided into four equal halves using values known as quartiles.
The first quartile of a dataset corresponds to the 25th percentile.
The second quartile of a dataset serves as a proxy for the 50th percentile. This sum corresponds to the median value of the dataset.
The third quartile of a dataset corresponds to the 75th percentile.
Finding the quartiles of a given dataset is simple with the R quantile() function.
Examples of how to use this function in practice are given in this tutorial.
Quartile Calculation in R
The R code below demonstrates how to determine the quartiles for a given dataset:
Let’s create a dataset
data<-c(104, 107, 212, 213, 214, 115, 151, 162, 193, 223, 241, 225, 227, 228, 233)
Now we can calculate quartiles of the dataset
quantile(data)
  0%   25%   50%   75%  100%
104.0 156.5 213.0 226.0 241.0
Here’s how to interpret the output:
The first value displays the minimum value in the dataset: 104.0
The second value displays the first quartile of the dataset: 156.5
The third value displays the second quartile of the dataset: 213.0
The fourth value displays the third quartile of the dataset: 226.0
The fifth value displays the maximum value in the dataset: 241.0
Let’s see how to visualize the same.
Visualizing Quartiles in R
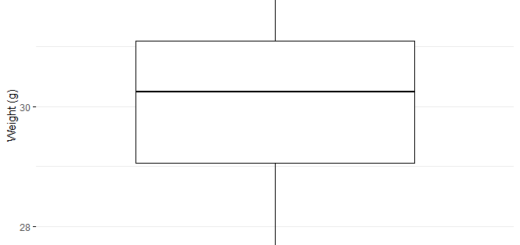
To visualize the quartiles of this dataset in R, we may use the boxplot() function:
boxplot(data)
Visualizing quartiles in R

Here’s how to interpret the boxplot:
The minimum value of 104.0 is shown in the bottom “whisker.”
The first quartile value of 156.5 is displayed on the box’s bottom line.
The second quartile value of 213.0 is shown on the black bar in the center of the box.
The third quartile value of 226.0 is shown on the box’s top line.
241.0 is shown as the maximum figure in the top “whisker”.
We can rapidly see the dataset’s value distribution thanks to this one visualization.
Further Resources:-
Because the greatest way to learn any programming language, even R, is by doing.
How to perform One-Sample Wilcoxon Signed Rank Test in R? – Data Science Tutorials
How to Avoid Overfitting? – Data Science Tutorials
How to Use “not in” operator in Filter – Data Science Tutorials


