Different types of scales and their Names
Different types of scales and their names, we use data to answer fascinating issues in statistics. However, not all information is created equal.
There are four different data measurement scales that are used to categorize various data types.
1. Nominal
2. Ordinal

3. Interval
4. Ratio
Different types of scales and their Names
Each measuring scale is defined in this post, along with examples of variables that can be utilized with each scale.
1. Nominal
A nominal scale is the most basic measurement scale we may use to name variables. A nominal scale is a scale that is used to label variables that do not have numerical values.
The following are some examples of variables that can be measured on a nominal scale.
Gender: Male, female
Eye color: Blue, green, brown
Hair color: Blonde, black, brown, grey, other
Political Preference: Republican, Democrat, Independent
The following are the characteristics of variables that can be measured on a nominal scale.
There is no inherent order to them. We can’t put eye colors in order of worst to best or lowest to highest, for example.
The terms “category” and “exclusivity” are mutually exclusive. A person cannot, for example, have both blue and brown eyes. Similarly, a person cannot reside in both a city and a rural location.
Counts are the only numbers we can calculate for these variables. For example, we can count the number of people who have blonde hair, black hair, brown hair, and so on.
The only measure of central tendency we can calculate for these variables is the mode. The mode tells us which category had the most counts. For example, we could find which eye color occurred most frequently.
LSTM Network in R » Recurrent Neural network »
2. Ordinal
An ordinal scale is the next type of measurement scale that can be used to label variables. Ordinal scale: A scale for labeling variables with a natural order but no quantitative difference in values.
The following are some examples of variables that can be measured using an ordinal scale.
Satisfaction: Very unsatisfied, unsatisfied, neutral, satisfied, very satisfied
Socioeconomic status: Low income, medium income, high income
The following are the characteristics of variables that can be measured on an ordinal scale:
There is a natural order to them. “Very satisfied” is preferable to “satisfied,” which is preferable to “neutral,” and so on.
It is impossible to assess the difference in values. For example, the difference between “extremely satisfied” and “satisfied” is not precisely the same as the difference between “satisfied” and “neutral.”
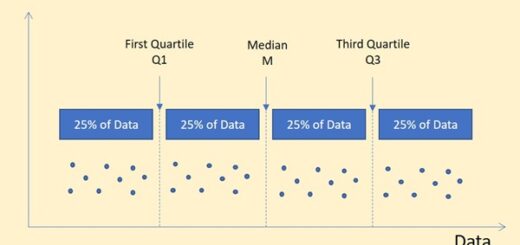
The mode and the median are two metrics of central tendency that can be calculated for these variables. The mode indicates which category received the most votes, while the median indicates the “middle” value.
Companies who are searching for feedback on their product or service frequently collect ordinal scale data through questionnaires.
3. Interval
An interval scale is the next form of measurement scale that can be used to mark variables. Interval scale: A scale for labeling variables with the natural order and a quantifiable difference in values but no “real zero” value.
The following are some examples of variables that can be measured using an interval scale:
Temperature: Measured in Fahrenheit or Celsius
Credit Scores: Measured from 300 to 850
The following are the characteristics of variables that can be measured on an interval scale:
There is a natural order to these variables.
These variables’ mean, median, mode, and standard deviation can all be calculated.
These variables have a precise value difference. We don’t know if the difference between “extremely satisfied” and “satisfied” is the same as the difference between “satisfied” and “neutral” since ordinal variables have no specific distinction between variables.
However, we know that the difference between a credit score of 850 and 800 is the same as the difference between 800 and 750 for variables on an interval scale.
These variables have no “true zero” value. It’s impossible to have a credit score of zero, for example. It’s also impossible to get a perfect SAT score.
In the case of temperatures, negative numbers (e.g. -10° F) are feasible, indicating that there is no actual zero point below which values cannot fall.
The advantage of interval scale data over nominal or ordinal data is that it may be studied in a variety of ways.
4. Ratio
A ratio scale is the last form of measurement scale that can be used to designate variables. A ratio scale labels variables with the natural order, a quantifiable difference between values, and a “true zero” value.
The following are some examples of variables that can be measured on a ratio scale:
Height: Can be measured in centimeters, inches, feet, and other units, but cannot be less than zero.
Weight: Can be measured in kilograms, pounds, or other units, and cannot be less than zero.
Length: Can be measured in centimeters, inches, feet, and other units, but cannot be less than zero.
The following are the characteristics of variables that can be measured on a ratio scale:
There is a natural order to these variables.
Descriptive statistics vs Inferential statistics: Guide – Data Science Tutorial
For these variables, we may compute the mean, median, mode, standard deviation, and a variety of other descriptive statistics.
These variables have a precise value difference. These variables have a value of “true zero.” The minimal value (zero) for length, weight, and height, for example, cannot be surpassed.
Ratio variables cannot take on negative values. As a result, it is possible to calculate the value ratio.
A person who weighs 200 pounds, for example, is said to weigh two times as much as someone who weighs 100 pounds. Similarly, someone 6 feet tall is 1.5 times taller than someone 4 feet tall.
A variety of methods can be used to analyze data that can be measured on a ratio scale.
Researchers could, for example, collect data on the heights of students at a certain school and produce the following metrics.
Height of the average person
Height Mode Height Mean Height
Height standard deviation
Height ratio of the highest to the shortest