How to Change Legend Position in ggplot2
Change Legend Position in ggplot2, When a shape feature is mapped to a variable in the aes() component of the ggplot() call, ggplot2 will automatically construct a legend for your chart.
Approach1: Legend outside Plot
It is possible to put the legend on the plot’s “top,” “right,” “bottom,” or “left.”
COUNTIF Function in R » Easy Calculation »
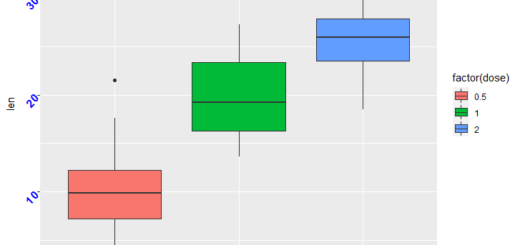
library(ggplot2)
ToothGrowth$dose<-factor(ToothGrowth$dose)
p <- ggplot(ToothGrowth, aes(x=dose, y=len, fill=dose)) +
geom_boxplot()
p

Legend in Bottom Position

p +theme(legend.position = "bottom")

Approach2: Legend on Inside of Plot
You may alternatively insert the legend on the inside of the plot by specifying the exact (x, y) coordinates.
legend inside the top right corner.
How to Make Boxplot in R-Quick Start Guide »
p+ theme(legend.position = c(.9, .9))

legend inside the bottom right corner:
p + theme(legend.position = c(.9, .1))

Approach3: Remove Legend
By choosing legend, you can completely remove the legend from a plot in ggplot2. as follows: position=”none” as follows.
How to Calculate Cross-Correlation in R »
p+ theme(legend.position = "none")

The legend box’s background color can be changed.
p + theme(legend.background = element_rect(fill="pink", size=0.5, linetype="solid"))

Approach4: Change Legend Label
Let’s change the legend label,

We can adjust or change Legend Position in ggplot2 in a variety of ways, as seen above.
Legends are a great way to add more variables to your data display. When we use ggplot2 to create a plot with legend, the legend is placed on the right side of the plot by default.