How to find dataset differences in R Quickly Compare Datasets
How to find dataset differences in R, when the pieces of information are changing between datasets it’s a difficult task to identify the same.
Here we are going to discuss the daff package in R, daff package helps us to identify the differences and visualize them in a beautiful way.
Features
Its compare rows and columns and provides information on
- Value changes
- Which new row/column added
- Which row/ column removed
- How many rows /columns added/removed?
Coefficient of Variation Example » Acceptable | Not Acceptable»
Let’s see how to execute the daff package in R.
Load Library
First load the daff package in R.
If you are not installed the package, you can install the daff package from CRAN
install.packages("daff")Now we need to create two data frames and let’s name them mydata1 and mydata2.
library(daff)
mydata1<-data.frame(Name=c("P1","P2","P3","P4","P5"),col1=c(1,2,3,4,5),col2=c(11,13,14,15,17))
mydata2<-data.frame(Name=c("P1","P2","P6","P4","P5"),col1=c(1,3,3,6,9))
Let’s see how to find the dataset differences
Daff Comparison: ‘mydata1’ vs. ‘mydata2’
               ---
 @@  Name col1 col2
     P1   1    11
 ->  P2   2->3 13
 +++ P6   3
 --- P3   3    14
 ->  P4   4->6 15
 ->  P5   5->9 17
-> Indicate the updated value.
—Indicate the row removed from the dataset
—If the symbol appears above the column indicate the column removed from the dataset.
+++indicate rows which are added
Basically, -> for updated data, – for removed data and + for added data.
Discriminant Analysis in r » Discriminant analysis in r »
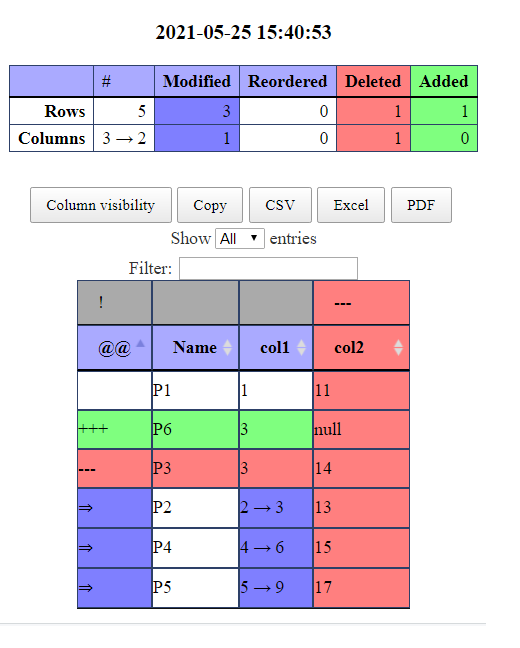
You can visualize the same using render_diff

The HTML output will be displayed in different colors.
Suppose if you want to compare the datasets based on the primary columns, you can just pass the information like,
render_diff(diff_data(mydata1,mydata2,id=c("Name","col1")))
You can provide multiple column names as a primary column. Like c(“Name”,”col1”)
In HTML view, you can download the results into multiple formats like CSV, Excel, and pdf.
Decision Trees in R » Classification & Regression »
Sorting option and filter option also available in HTML view.
In daff package many other arguments are available you can make use of the same.
diff_data(data_ref, data, always_show_header = TRUE,
  always_show_order = FALSE, columns_to_ignore = c(),
  count_like_a_spreadsheet = TRUE, ids = c(),
  ignore_whitespace = FALSE, never_show_order = FALSE,
  ordered = TRUE, padding_strategy = c("auto", "smart", "dense",
  "sparse"), show_meta = TRUE, show_unchanged = FALSE,
  show_unchanged_columns = FALSE, show_unchanged_meta = FALSE,
  unchanged_column_context = 1L, unchanged_context = 1L)
Sometimes we need to ignore some particular columns.
columns_to_ignore argument will be very useful (character List of columns to ignore in all calculations.
Changes related to these columns should be discounted)
Regression analysis in R-Model Comparison »
You can export the comparison results into a CSV file, for that you need to store the result into variables.
out<-diff_data(mydata1,mydata2,id="Name")
write_diff(out,"D:/RStudio/daff/Result.csv")
Suppose if you want to read the output, you can make use of read_diff
read_diff("D:/RStudio/daff/Result.csv")

